XPO Logistics Announces Fourth Quarter and Full Year 2021 Results
Reports highest revenue of any quarter in company history
Provides 2022 guidance for adjusted EBITDA of $1.36 billion to $1.40 billion and adjusted diluted EPS of $5.00 to $5.45, reflecting year-over-year increases of 11% and 22%, respectively, at the mid-point of each range
Expects 2022 adjusted operating ratio in North American LTL to inflect to year-over-year improvement mid-year
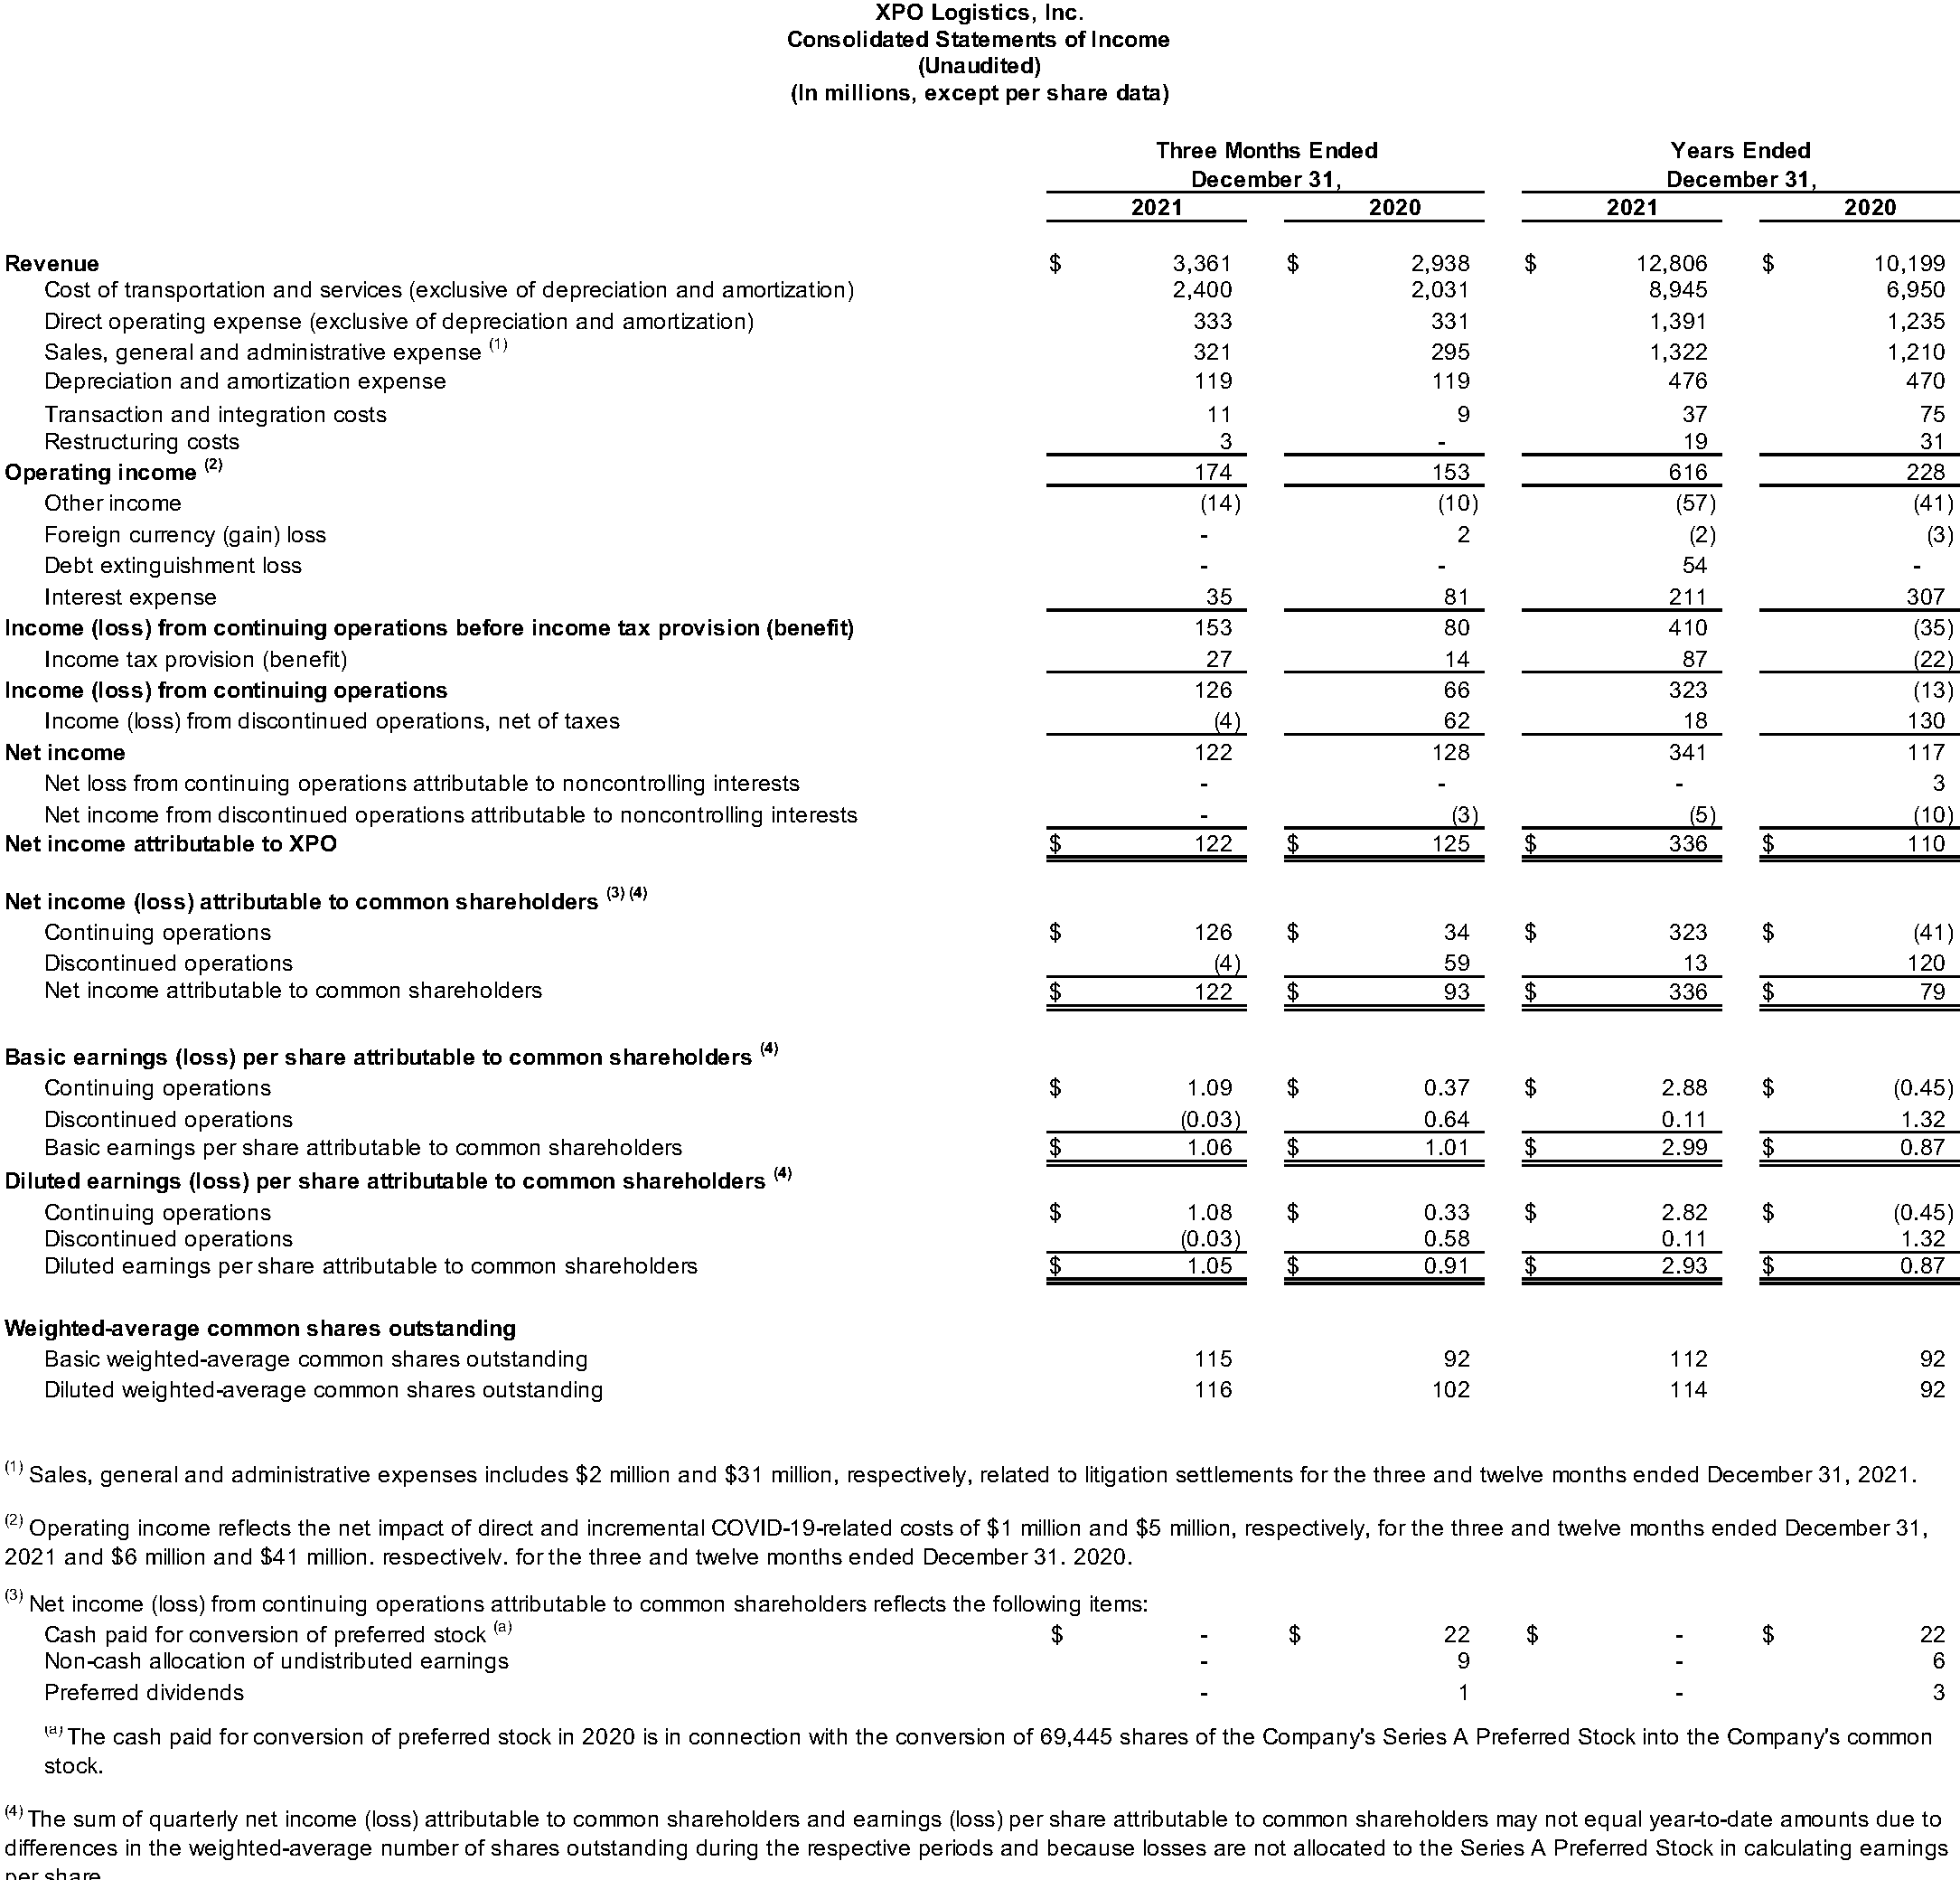
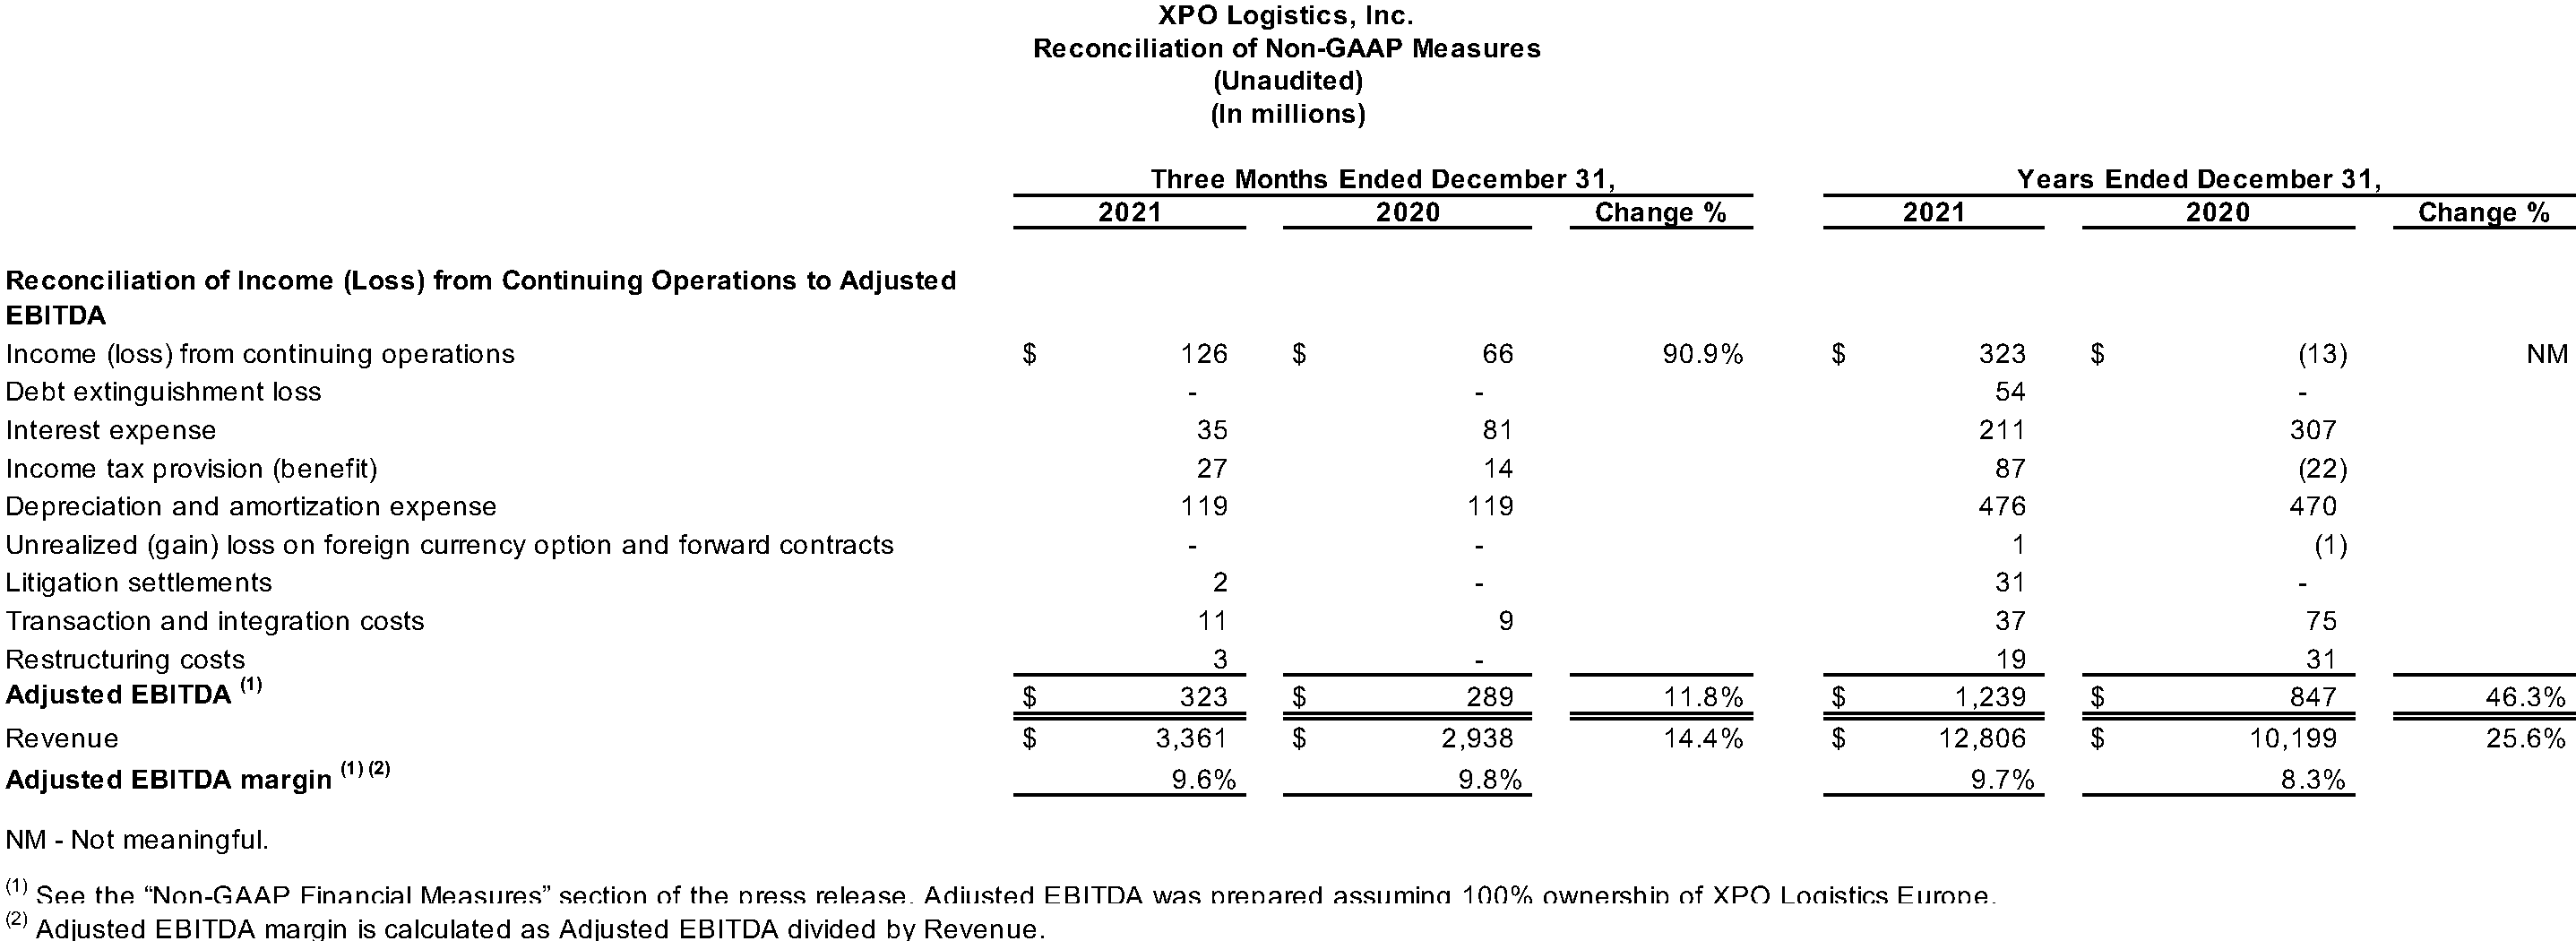
XPO Logistics, Inc. (NYSE: XPO) today announced its financial results for the fourth quarter 2021. Revenue increased to $3.36 billion for the fourth quarter, compared with $2.94 billion for the same period in 2020. Net income from continuing operations attributable to common shareholders was $126 million for the fourth quarter, compared with $34 million for the same period in 2020. Operating income was $174 million for the fourth quarter, compared with $153 million for the same period in 2020. Income from continuing operations was $126 million, compared with $66 million for the same period in 2020. Diluted earnings from continuing operations per share was $1.08 for the fourth quarter, compared with $0.33 for the same period in 2020.
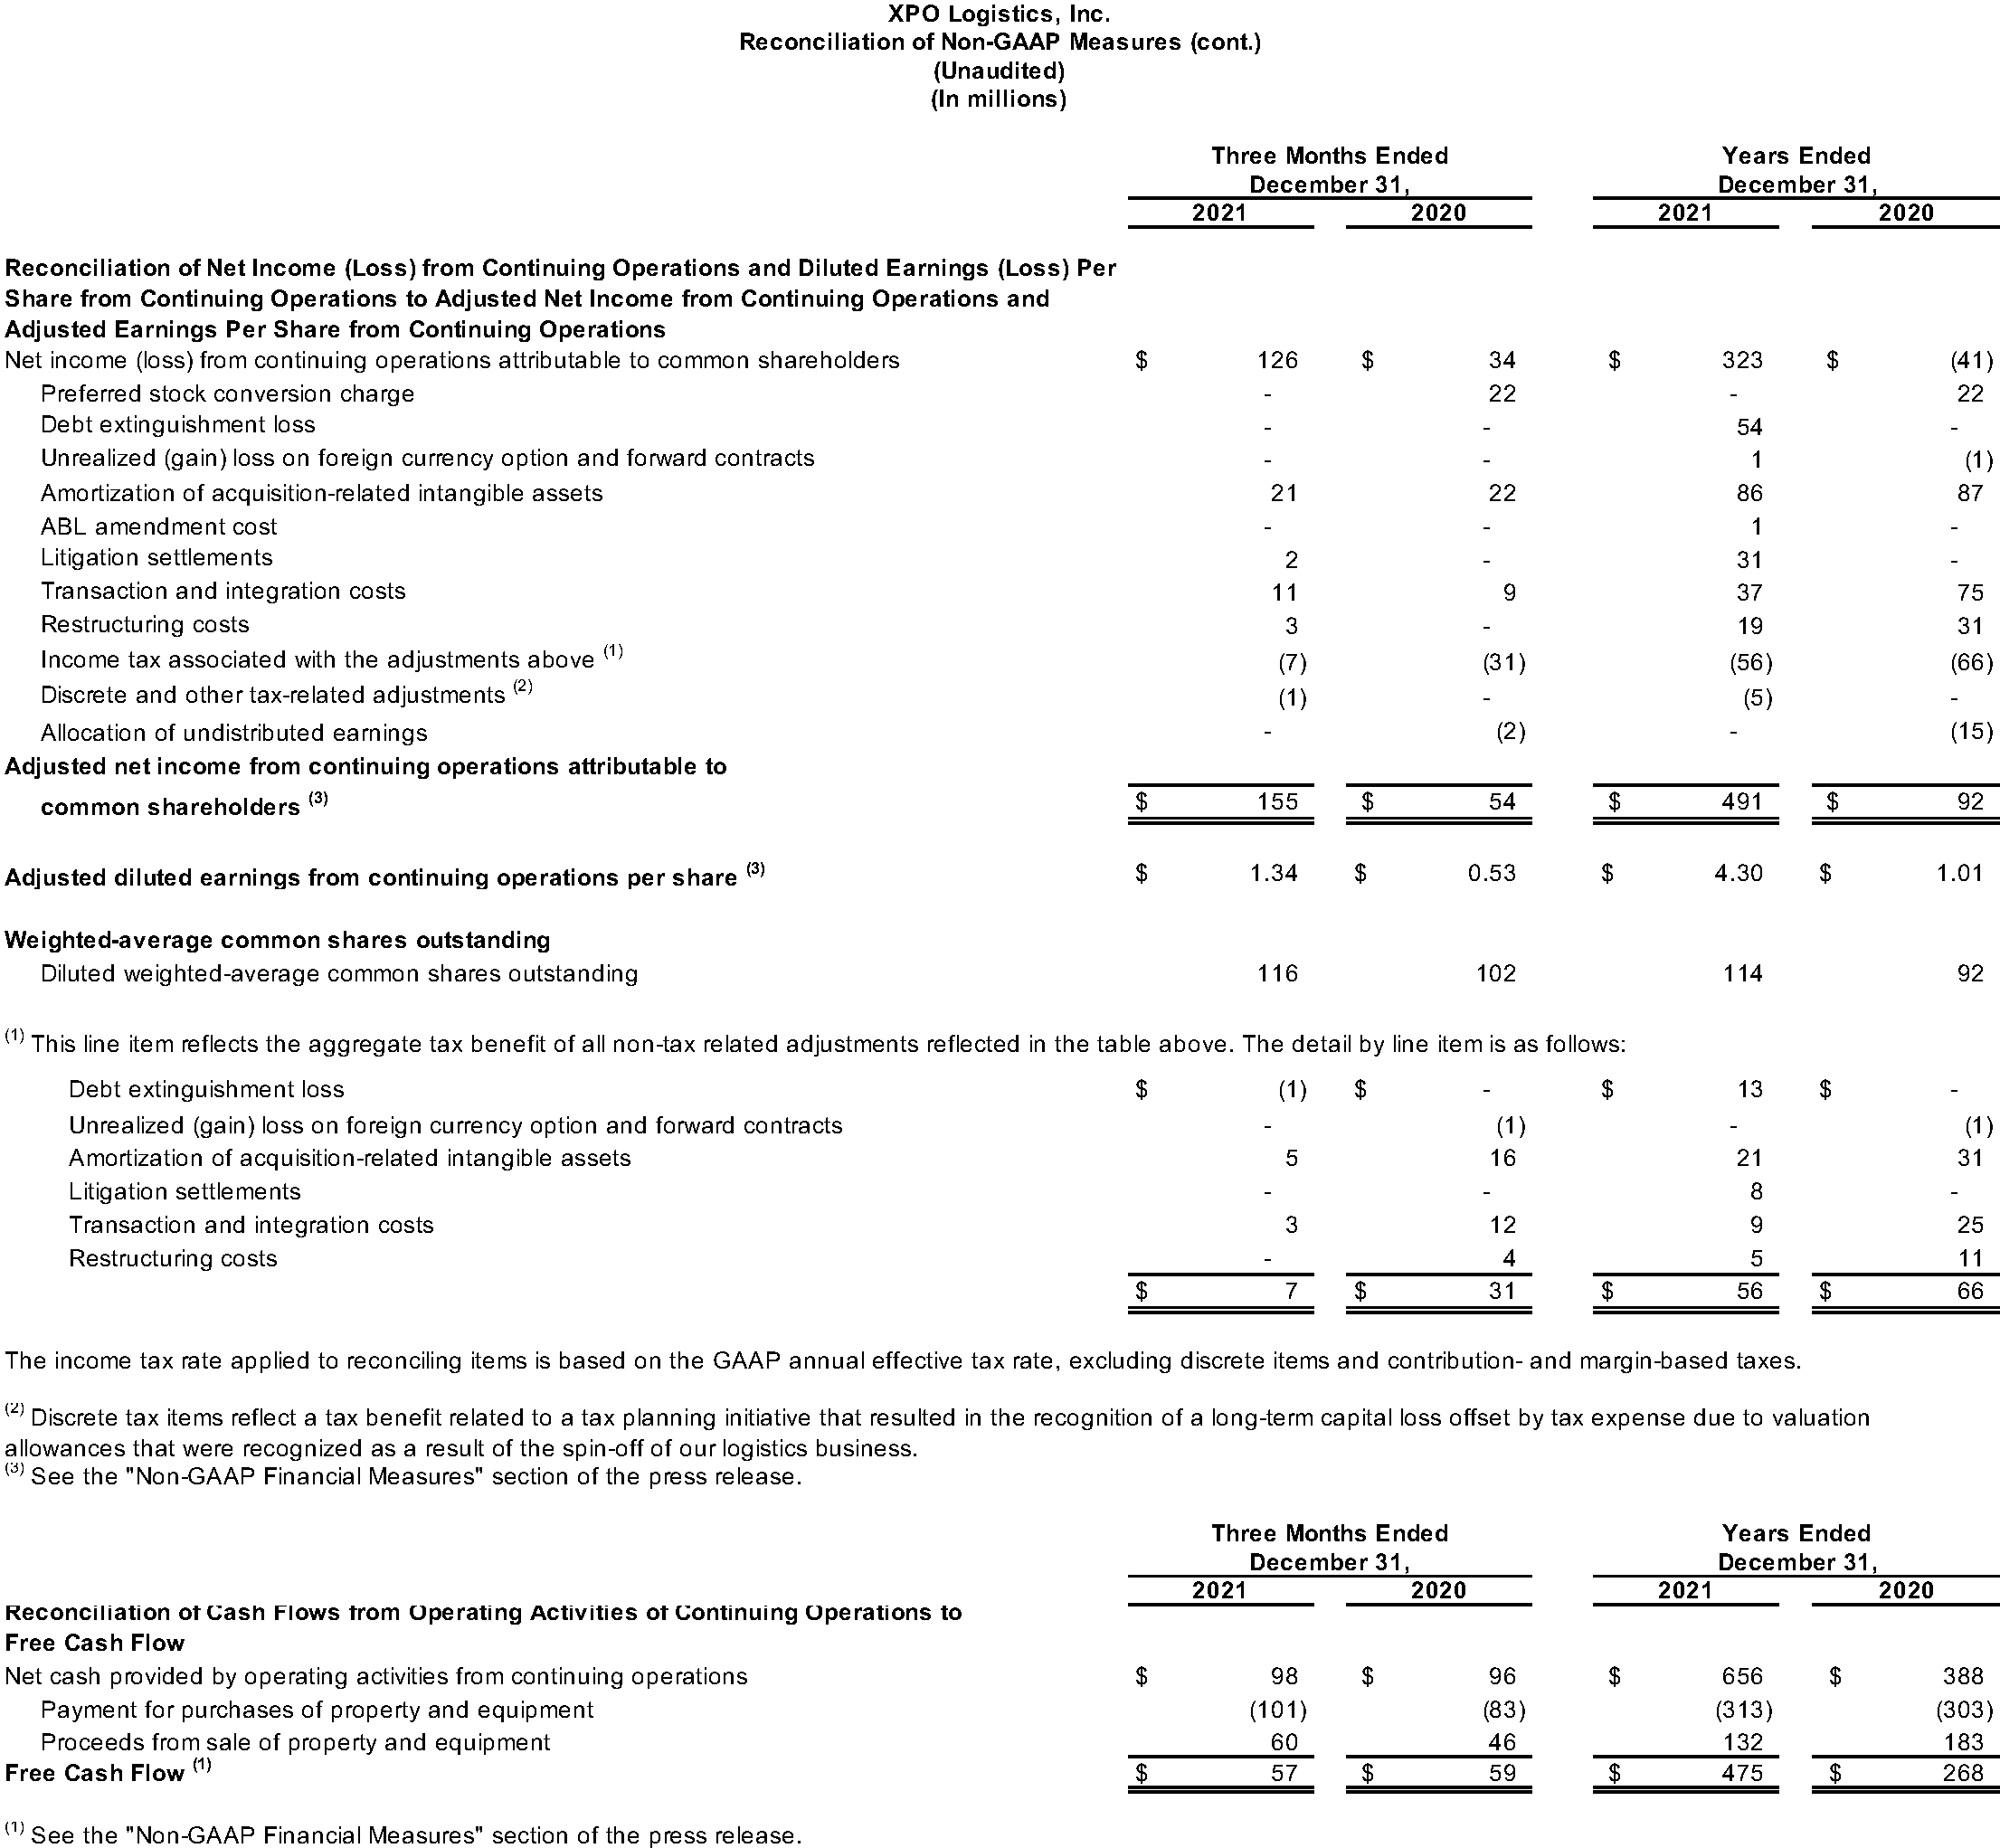
Adjusted net income attributable to common shareholders, a non-GAAP financial measure, was $155 million for the fourth quarter, compared with $54 million for the same period in 2020. Adjusted diluted earnings from continuing operations per share, a non-GAAP financial measure, was $1.34 for the fourth quarter, compared with $0.53 for the same period in 2020.
Adjusted earnings before interest, taxes, depreciation and amortization (“adjusted EBITDA”), a non-GAAP financial measure, increased to $323 million for the fourth quarter, compared with $289 million for the same period in 2020.
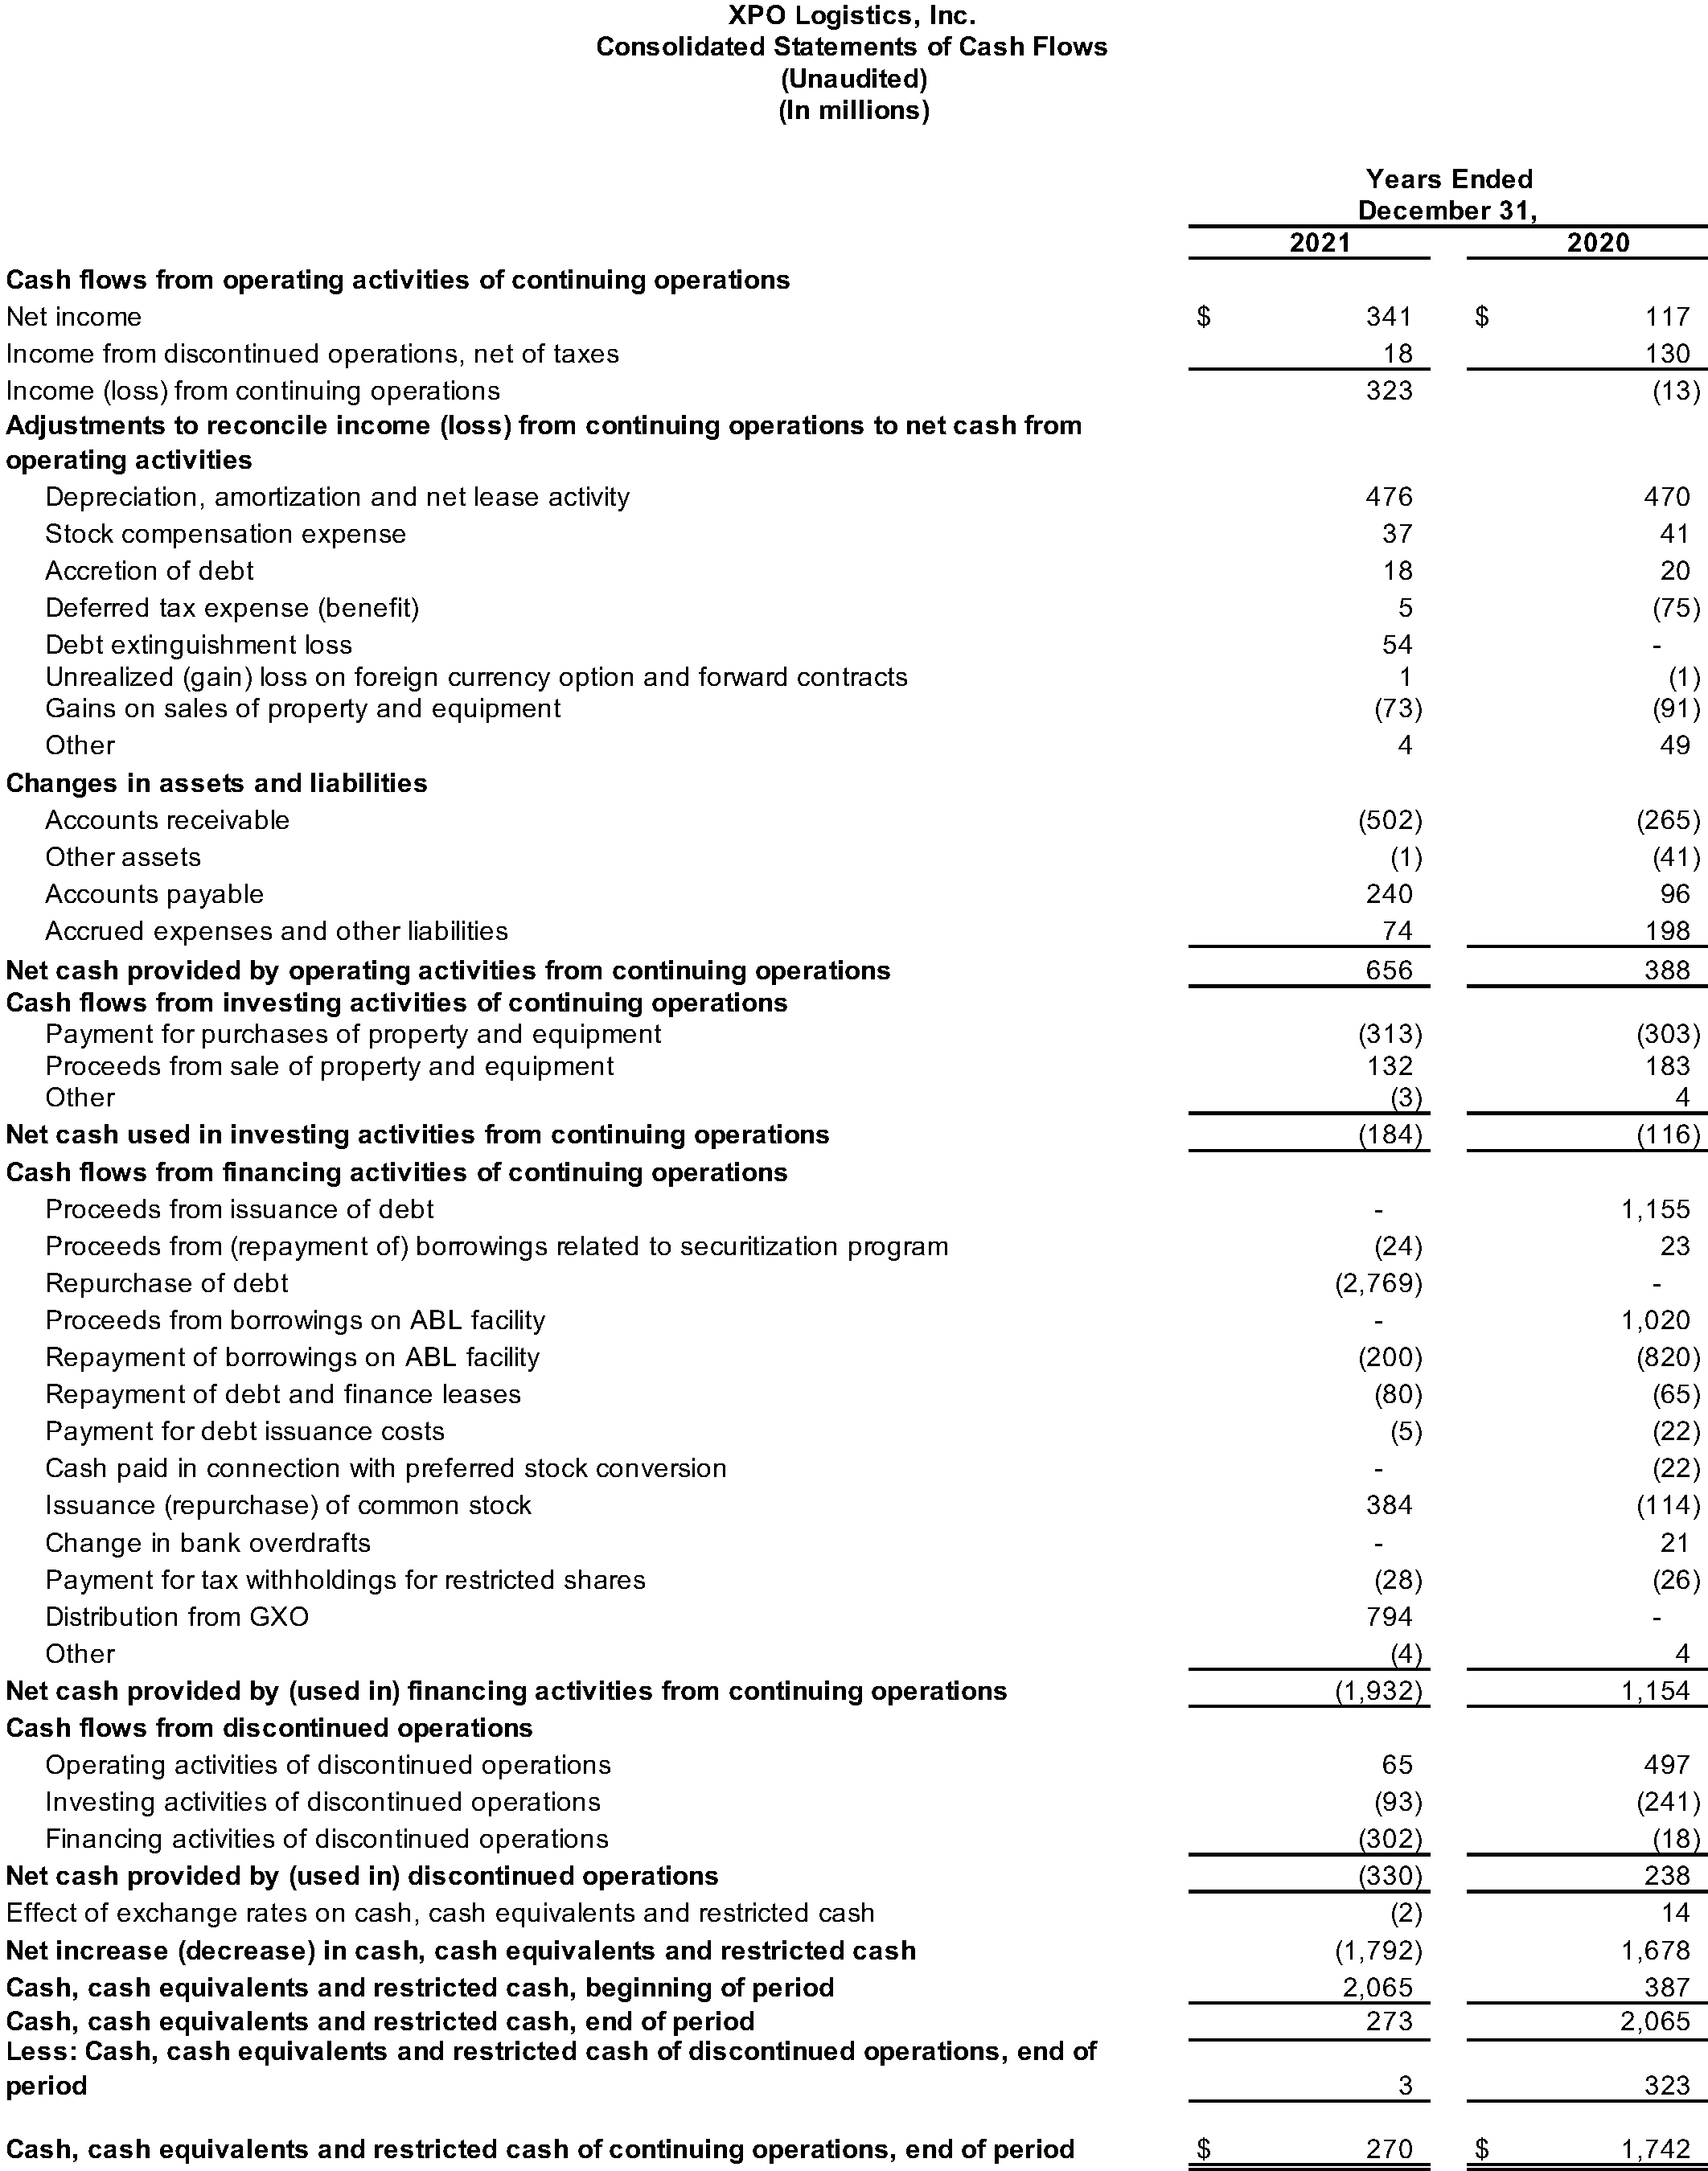
For the fourth quarter 2021, the company generated $98 million of cash flow from operating activities and $57 million of free cash flow, a non-GAAP financial measure. For the full year 2021, the company generated $656 million of cash flow from operating activities and $475 million of free cash flow.
Reconciliations of non-GAAP financial measures used in this release are provided in the attached financial tables.
2022 Guidance
- Adjusted EBITDA of $1.36 billion to $1.40 billion, including first quarter adjusted EBITDA of $280 million to $285 million;
— North American LTL expected to generate at least $1 billion of full year adjusted EBITDA; - Year-over-year improvement of more than 100 basis points in North American LTL adjusted operating ratio;
- Depreciation and amortization of approximately $400 million, excluding amortization of acquisition-related intangible assets;
- Interest expense of $170 million to $180 million;
- Effective tax rate of 24% to 25%; and
- Adjusted diluted EPS of $5.00 to $5.45, excluding amortization of acquisition-related intangible assets, and assuming 117 million diluted shares outstanding at year-end 2022.
With respect to 2022 cash flows:
- Gross capital expenditures of $500 million to $550 million;
- Net capital expenditures of $425 million to $475 million; and
- Free cash flow of $400 million to $450 million.
CEO Comments
Brad Jacobs, chairman and chief executive officer of XPO Logistics, said, “Our company delivered a strong fourth quarter finish to a year of solid growth. We reported the highest revenue of any quarter in our history, and generated adjusted EBITDA that exceeded our guidance for both the quarter and the year.
“In North American LTL, the operating ratio degradation we saw last quarter bottomed out in October with the launch of our action plan. This created immediate momentum — we reduced the year-over-year operating ratio erosion throughout the quarter and significantly improved our service metrics. We also grew yield by a record 11% ex fuel, and yield remained strong in January. Given our traction with LTL volume and yield, we expect our 2022 adjusted operating ratio to inflect to year-over-year improvement mid-year."
“Our North American truck brokerage business is continuing to far outpace industry growth, propelled by our XPO Connect digital brokerage platform. This technology was a major tailwind behind the 29% load growth we achieved in 2021 year-over-year, including 35% load growth from our top 20 customers. In the fourth quarter, 70% of our brokerage orders were created or covered digitally. We expect to continue to deliver double-digit volume growth in North American truck brokerage in 2022 and going forward.”
Jacobs continued, “Our 2022 guidance anticipates a year of strong profitability for our shareholders, with adjusted EBITDA of $1.36 billion to $1.40 billion, a year-over-year increase of 11% at the mid-point, and adjusted diluted EPS of $5.00 to $5.45, a year-over-year increase of 22% at the mid-point.”
Update on North American LTL Action Plan
XPO is taking decisive action in the five areas of its previously announced action plan to enhance North American LTL network efficiencies and growth. The company began executing the plan in October 2021, and expects its LTL adjusted operating ratio to inflect to year-over-year improvement mid-year 2022, with longer-term tactical actions also underway:
- Improve network flow. The company’s targeted fourth quarter initiatives have significantly improved network fluidity, while generating stronger service metrics in areas such as on-time transit and freight handling as the quarter progressed;
- Drive pricing. The company pulled its typical January 2022 General Rate Increase forward to November 2021 and instituted accessorial charges for detained trailers, oversized freight and special handling, contributing to record 11% growth in yield, excluding fuel, in the fourth quarter;
- Expand the driver base. The company graduated approximately 900 professional drivers from its driver training schools in 2021, exceeding its goal, and intends to double the number of 2021 graduates in 2022;
- Increase trailer production. In January, the company added a second production line at its Searcy, Arkansas trailer manufacturing facility, and expects to double the number of units produced in 2022 year-over-year; and
- Expand footprint by 900 net new doors (approximately 6%) by year-end 2023. The company added a total 149 net doors to the network from October 2021 through January 2022 with the opening of three new terminals: Chicago Heights, Illinois; Sheboygan, Wisconsin; and Texarkana, Arkansas. Additionally, the company plans to open new fleet maintenance shops in Ohio, Florida, New York and Nevada in the first quarter of 2022.
Results by Business Segment
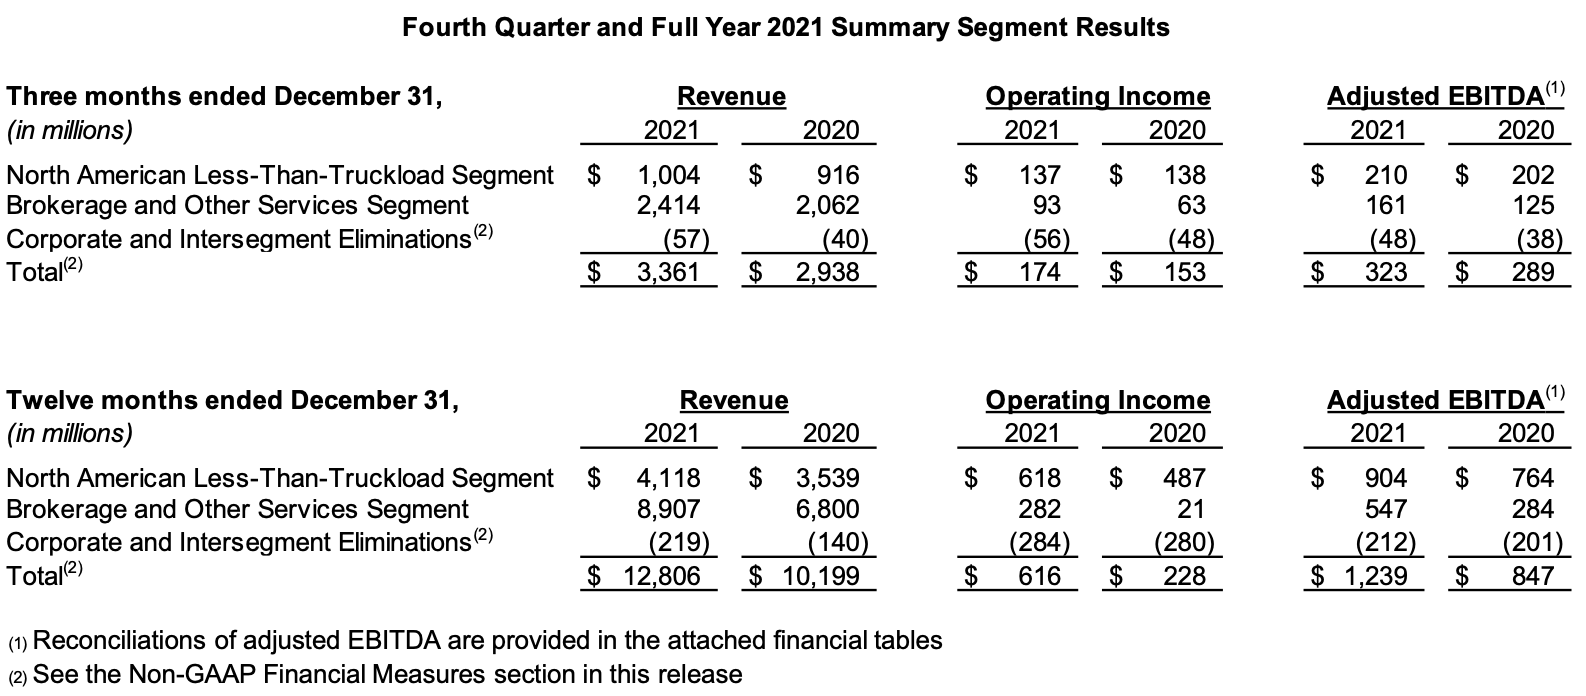
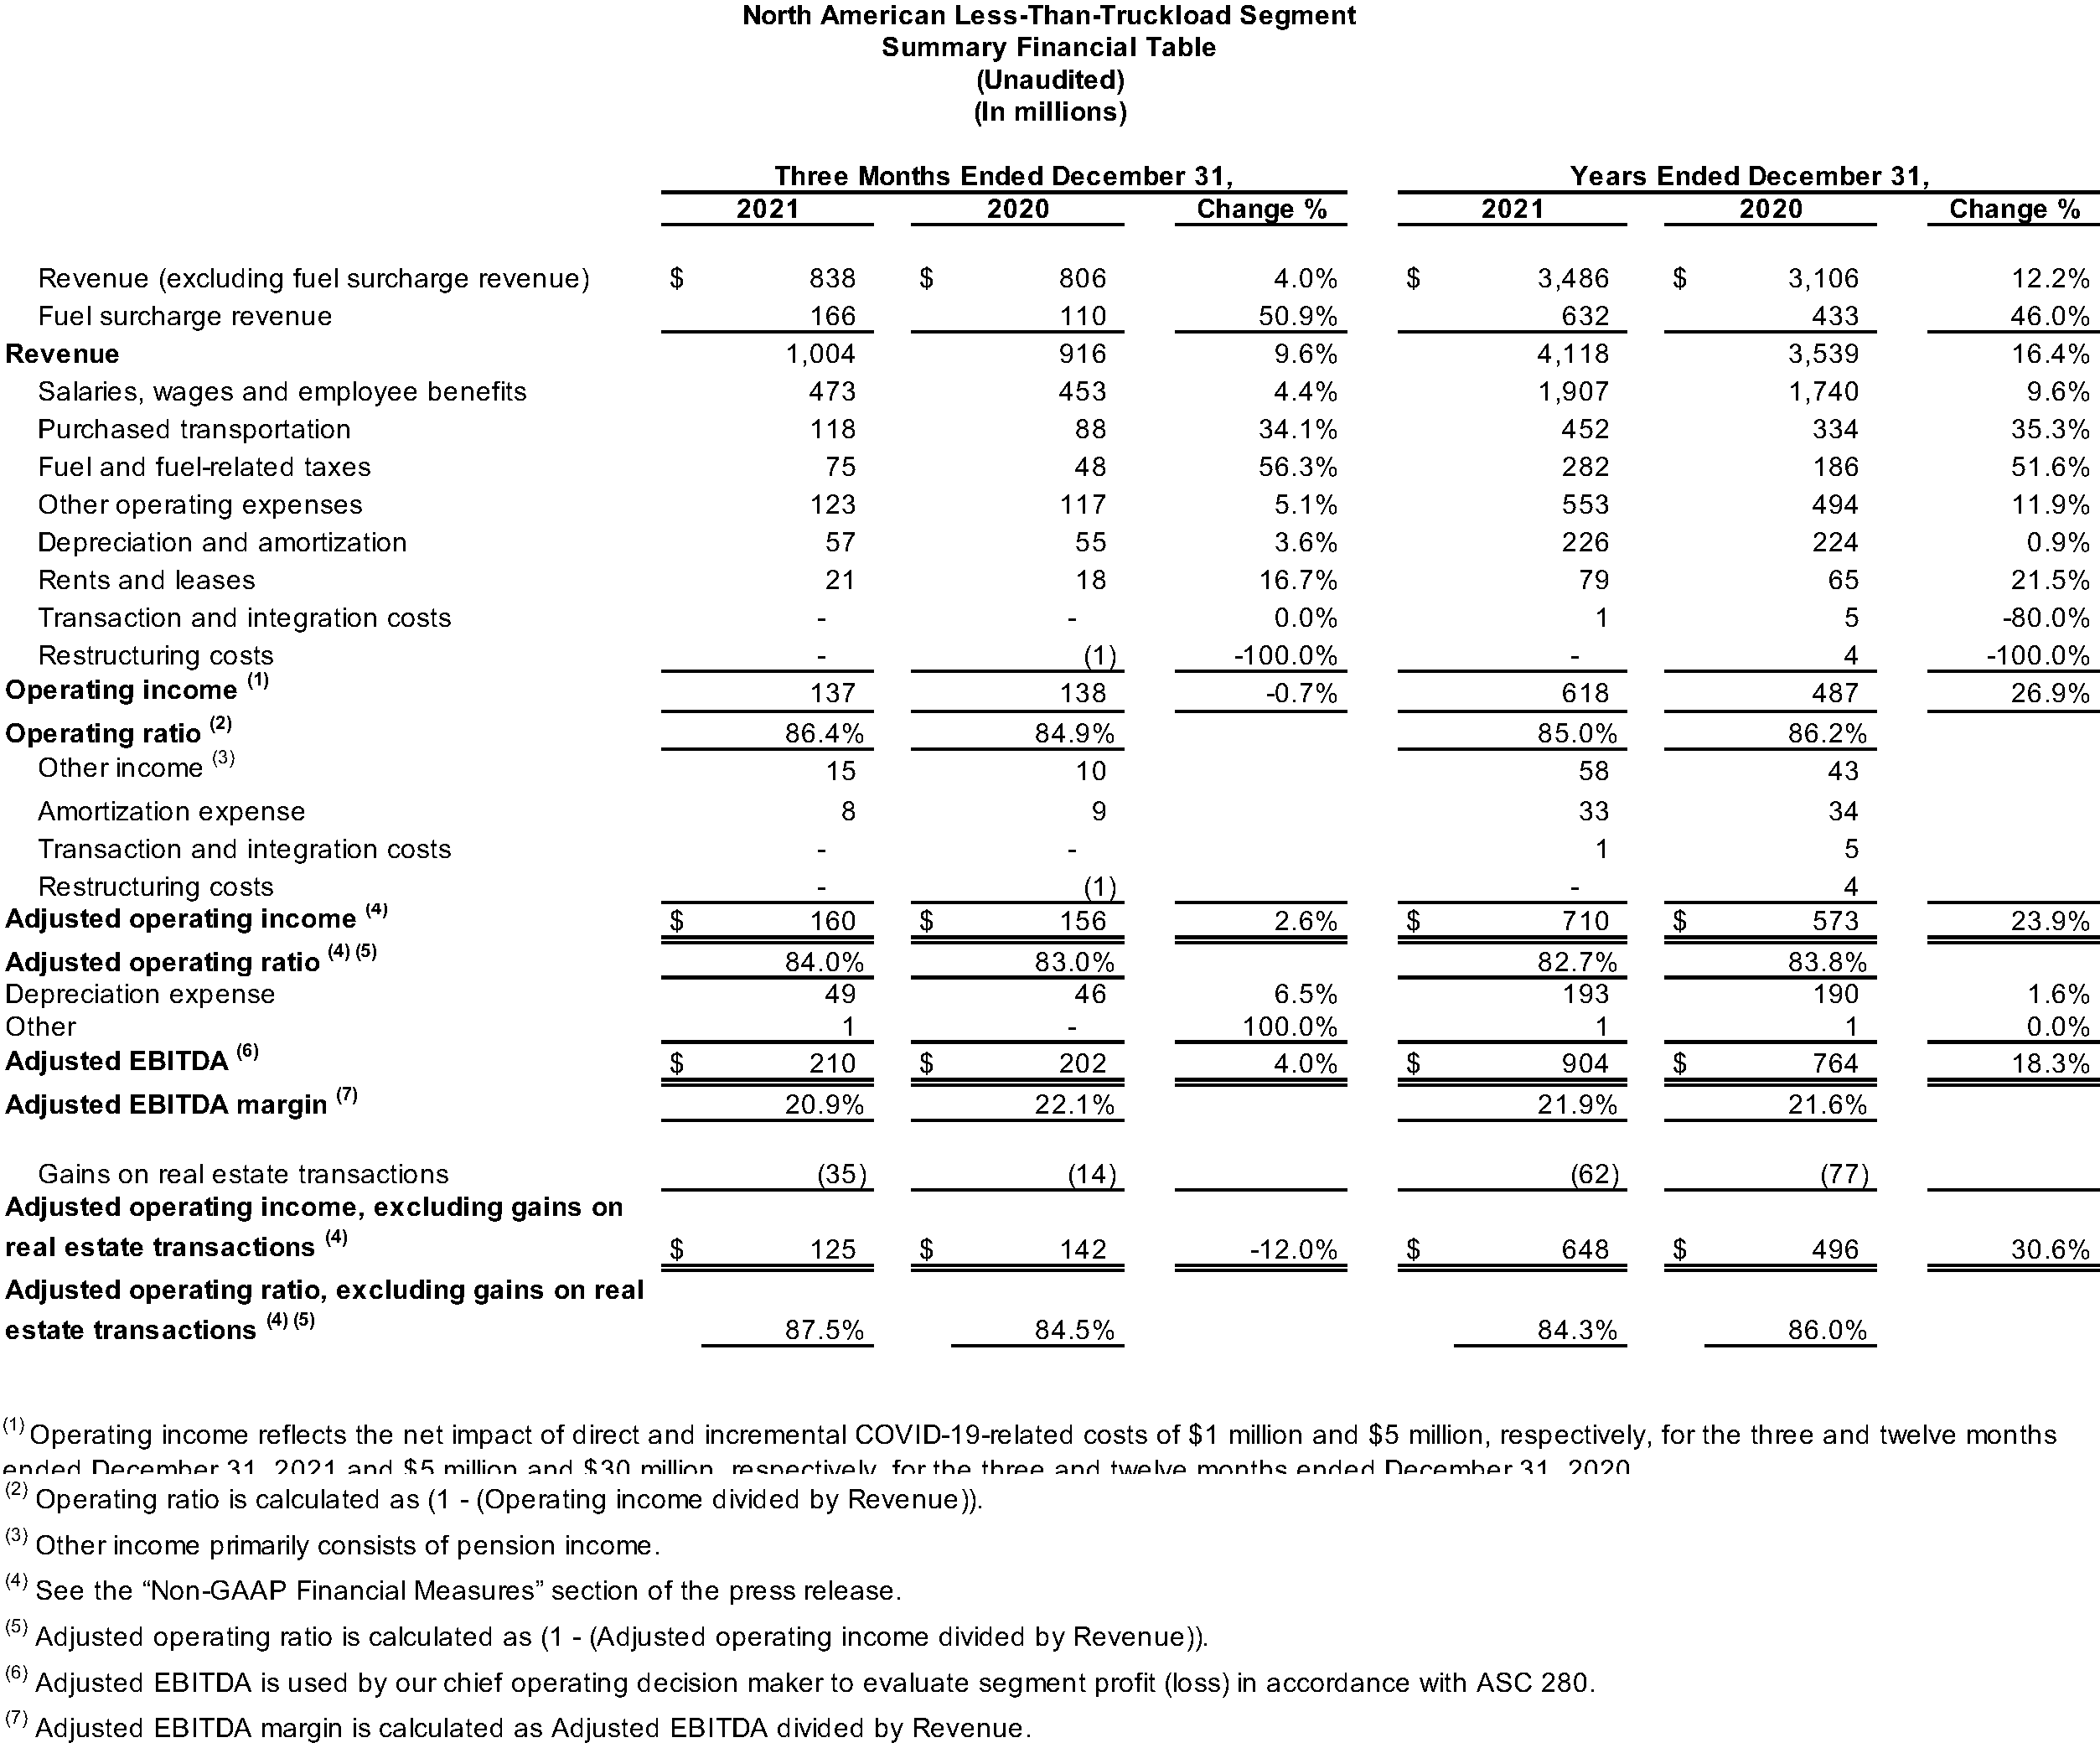
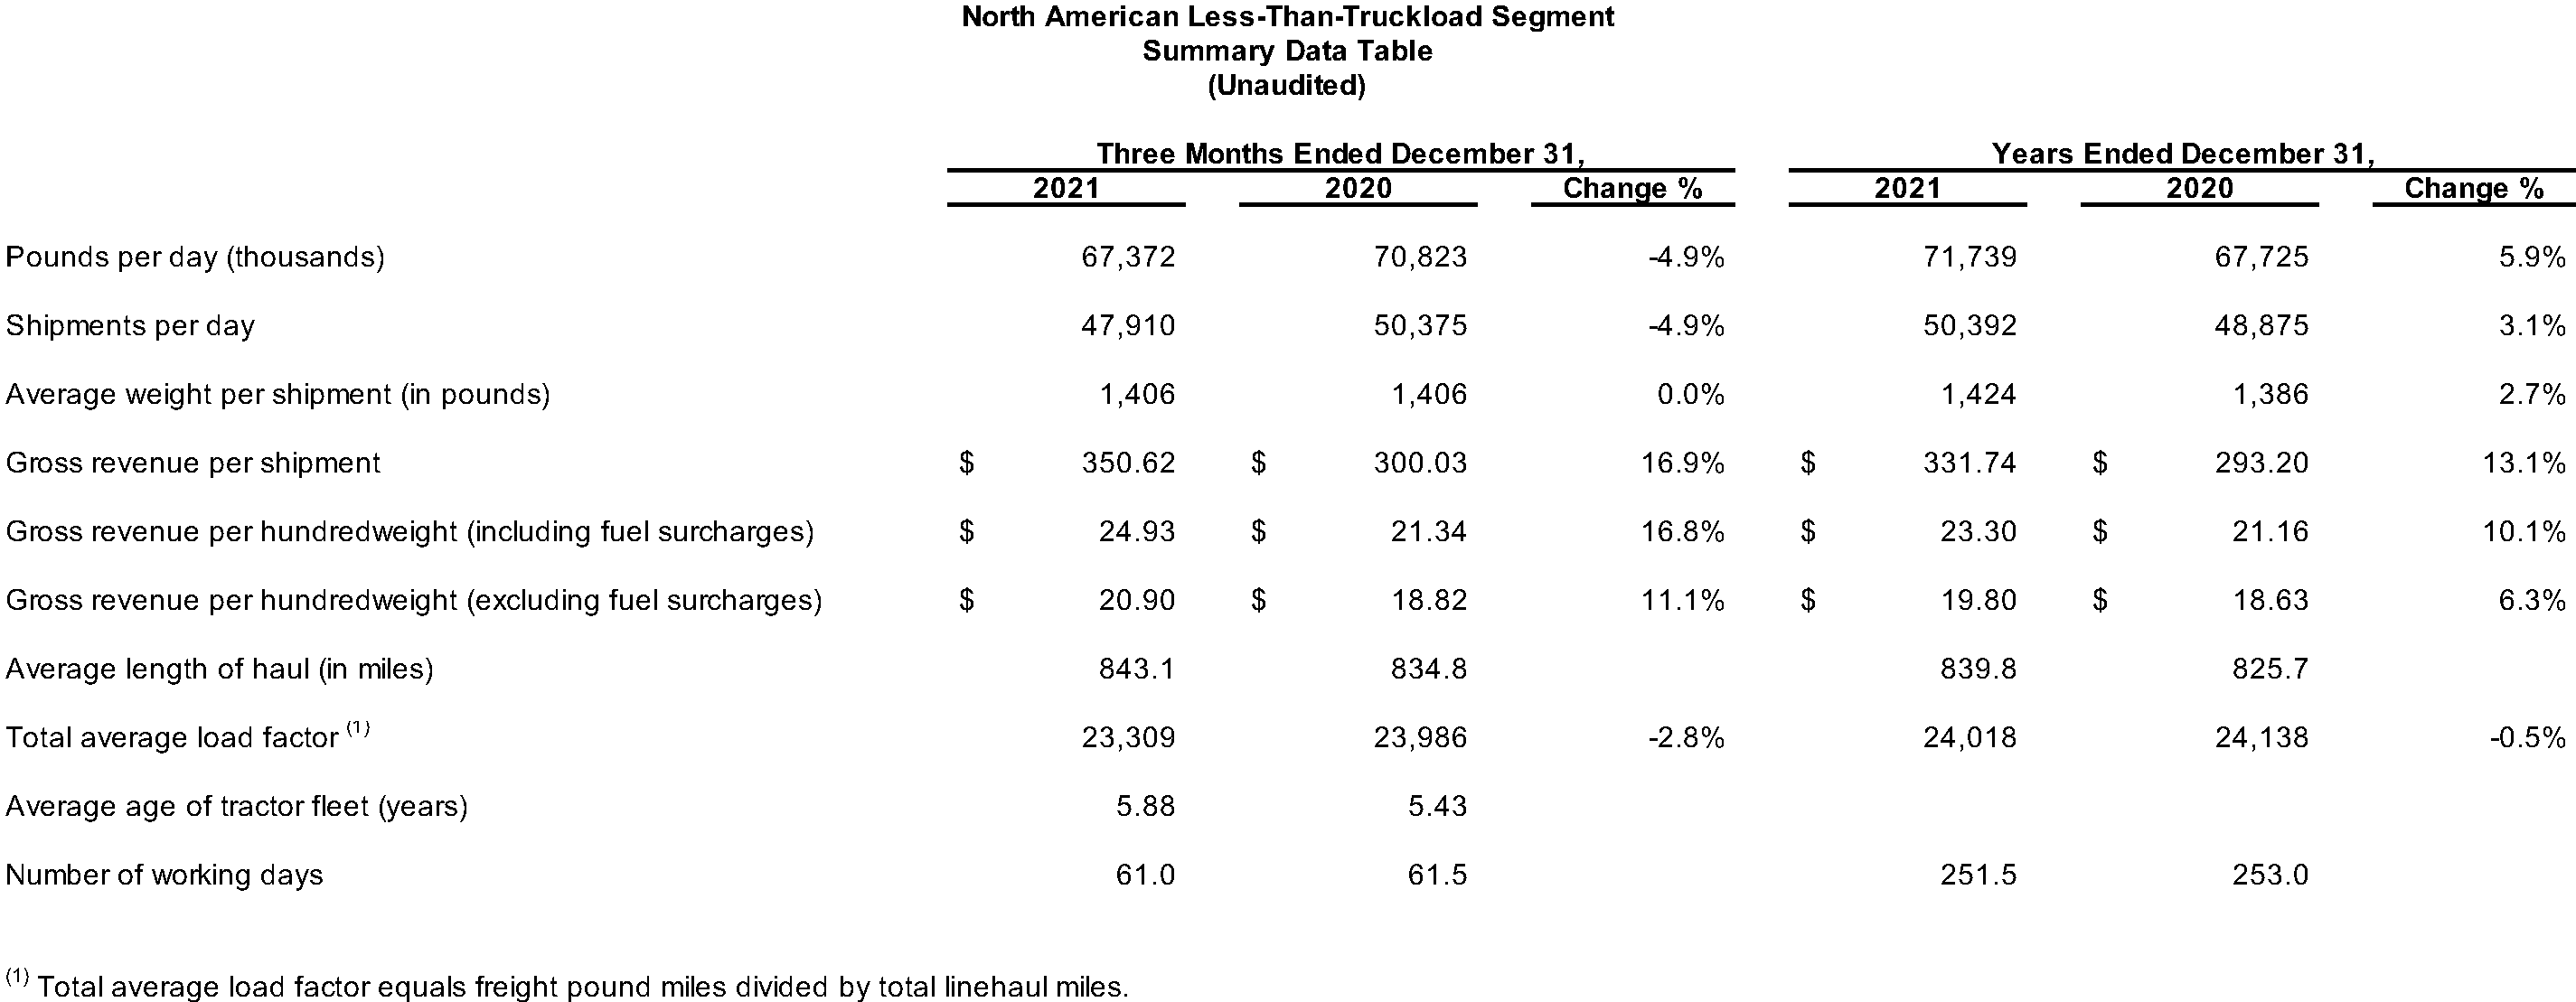
- North American Less-Than-Truckload: The segment generated revenue of $1.0 billion for the fourth quarter 2021, compared with $916 million for the same period in 2020. The year-over-year increase in segment revenue reflects an increase in gross revenue per hundredweight, partially offset by a decline in average weight per day.
Operating income for the segment was $137 million for the fourth quarter 2021, compared with $138 million for the same period in 2020. Adjusted EBITDA for the fourth quarter 2021 was $210 million, compared with $202 million for the same period in 2020. Adjusted EBITDA reflects a $35 million gain on sale of real estate in the fourth quarter of 2021, compared with a $14 million gain for the same period in 2020.
The fourth quarter operating ratio for the segment was 86.4% and the adjusted operating ratio was 84.0%. Excluding a gain from sale of real estate, the fourth quarter adjusted operating ratio was 87.5%. -
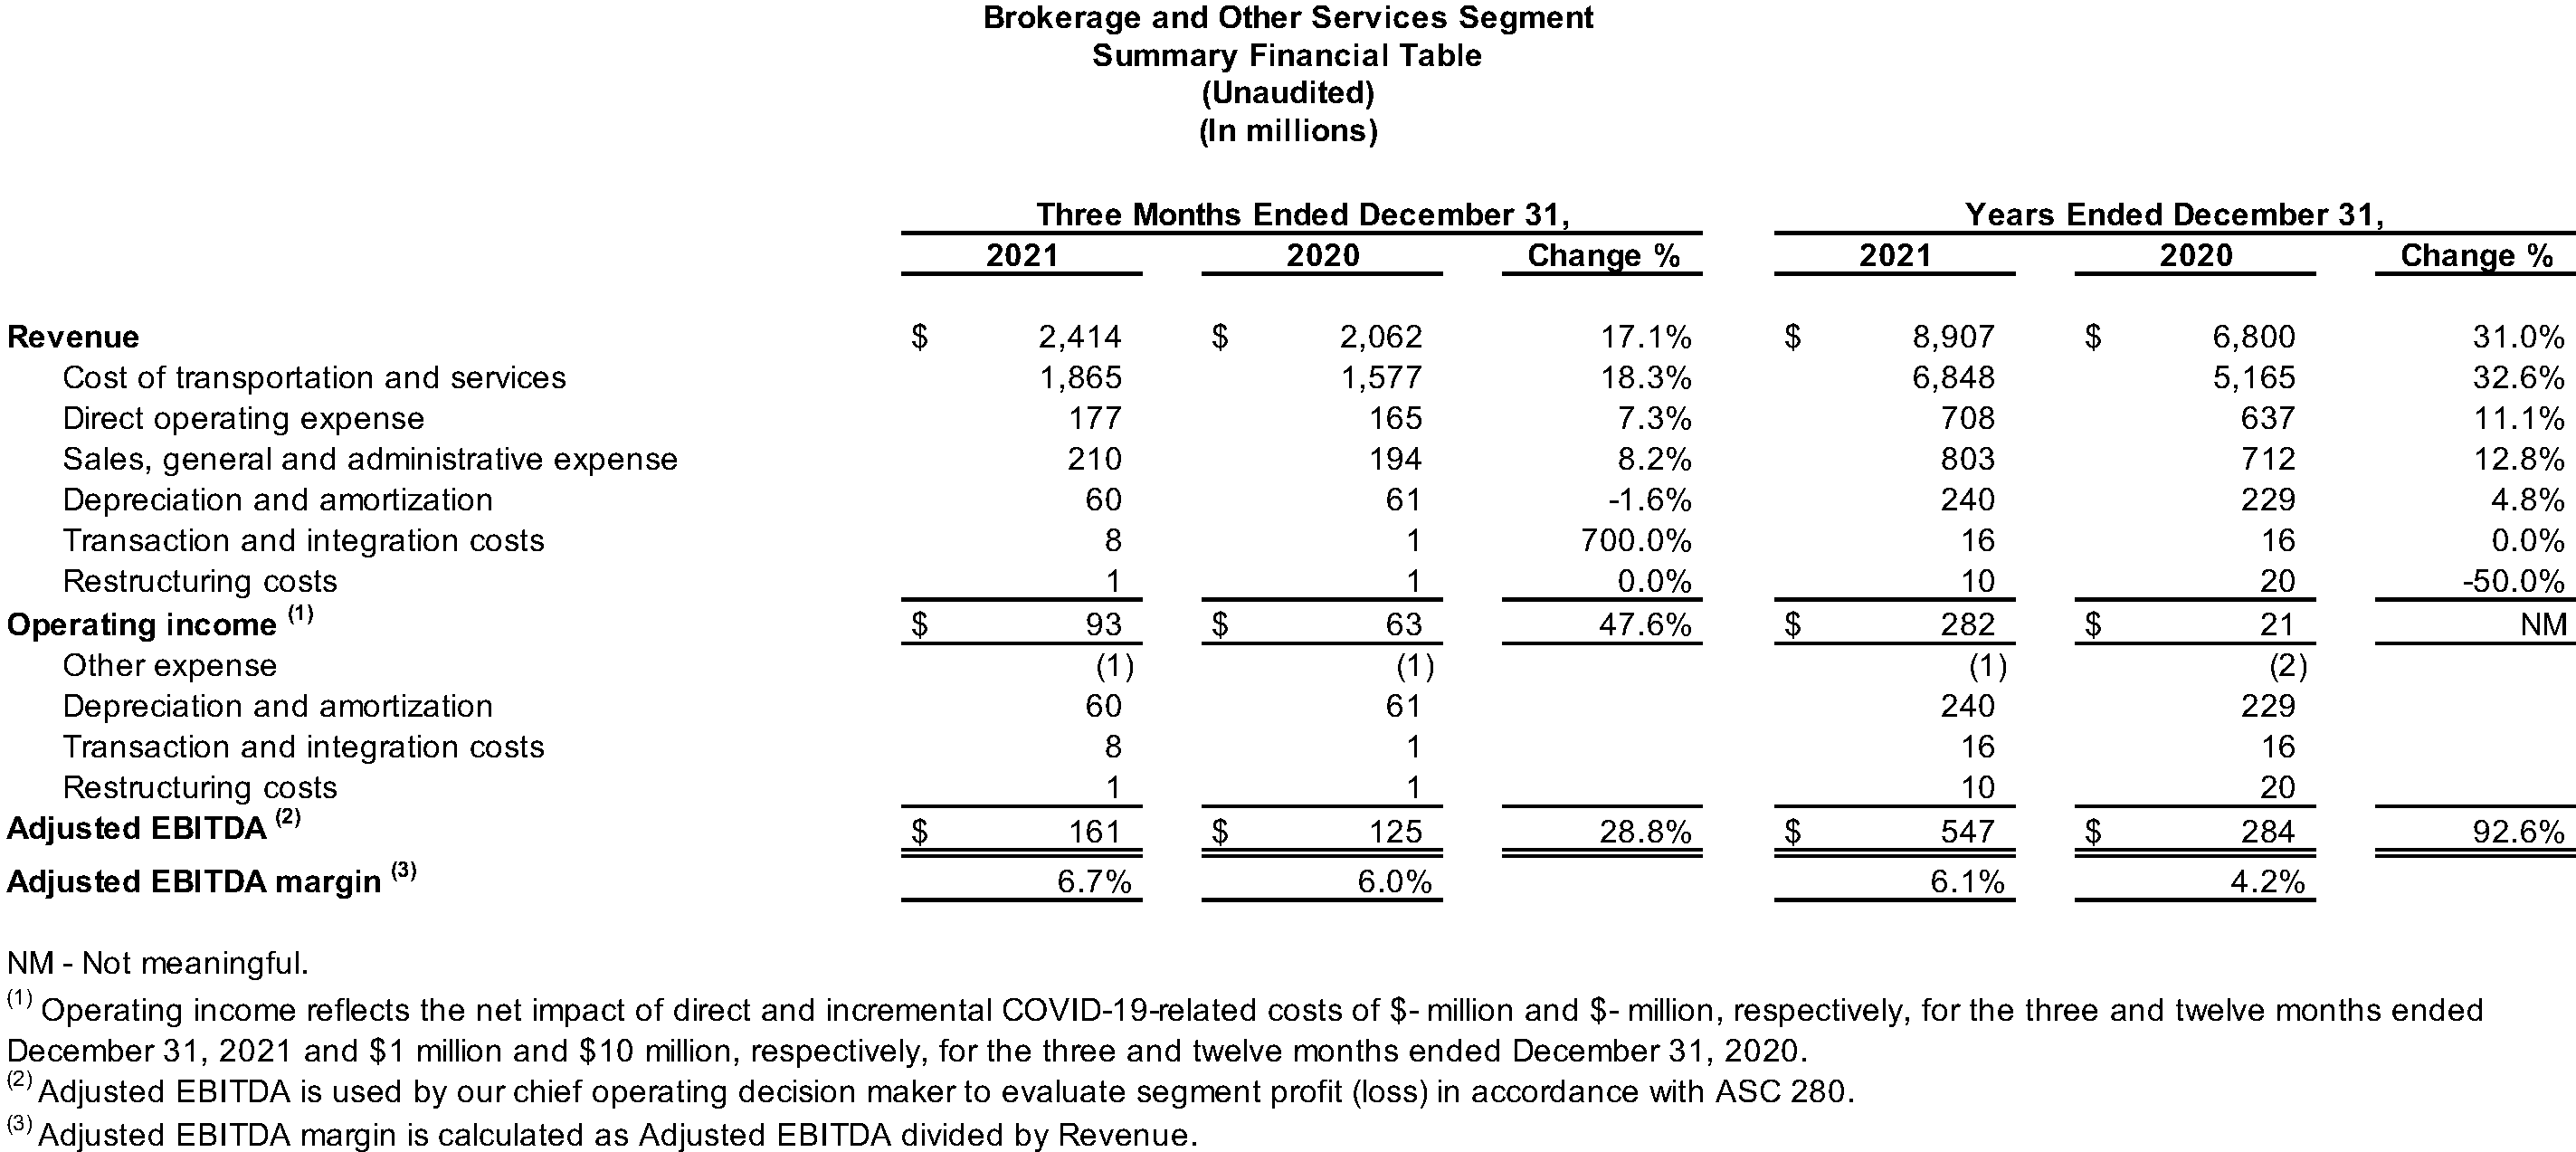
Brokerage and Other Services: The segment generated revenue of $2.41 billion for the fourth quarter 2021, compared with $2.06 billion for the same period in 2020. The year-over-year increase in segment revenue reflects a significant increase in North American truck brokerage loads per day, facilitated by the company’s XPO Connect® digital platform, as well as strength in other brokerage services.
Operating income for the segment was $93 million for the fourth quarter 2021, compared with $63 million for the same period in 2020. Adjusted EBITDA was $161 million for the fourth quarter 2021, compared with $125 million for the same period in 2020. The year-over-year increase in adjusted EBITDA was primarily driven by higher revenue due to volume growth, as well as by strong pricing in other brokerage services, partially offset by higher compensation and facilities costs.
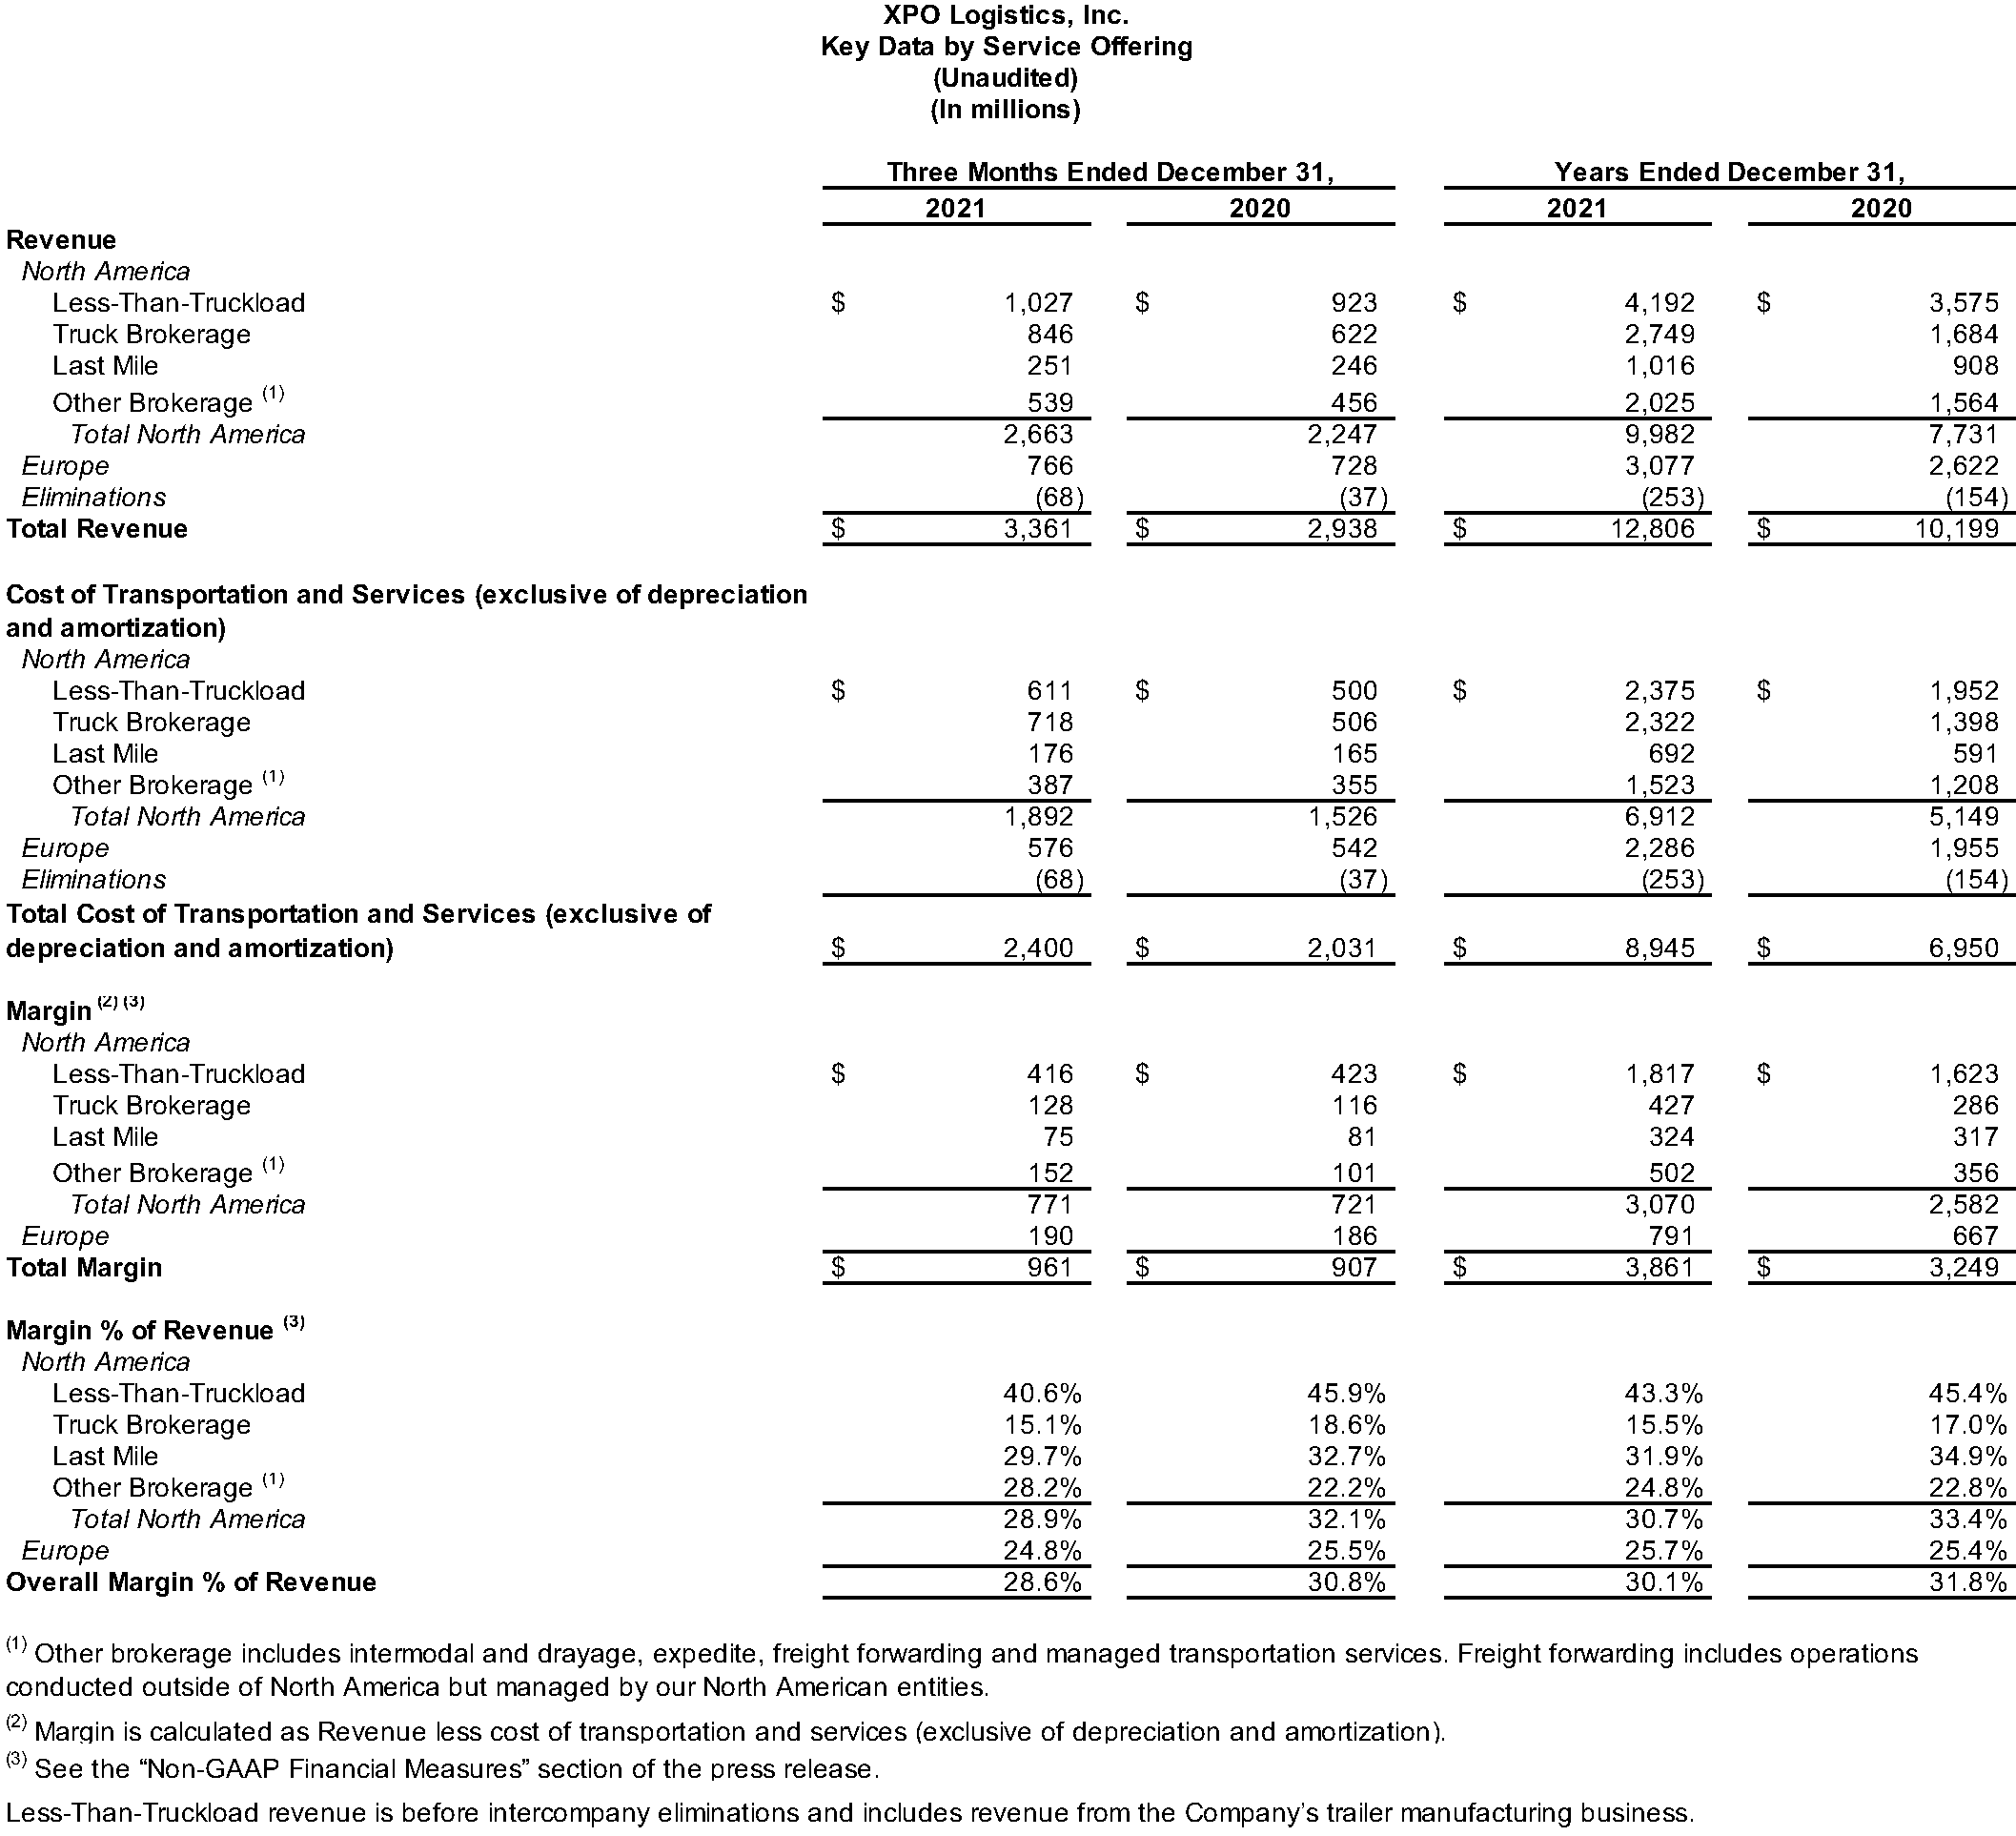
Truck brokerage revenue in North America increased 36% year-over-year to $846 million for the fourth quarter, compared with $622 million for the same period in 2020. The increase in revenue was primarily driven by a 22% average increase in loads per day in the quarter. Margin (revenue less cost of transportation and services) increased 10% year-over-year to $128 million for the quarter, compared with $116 million for the same period in 2020.
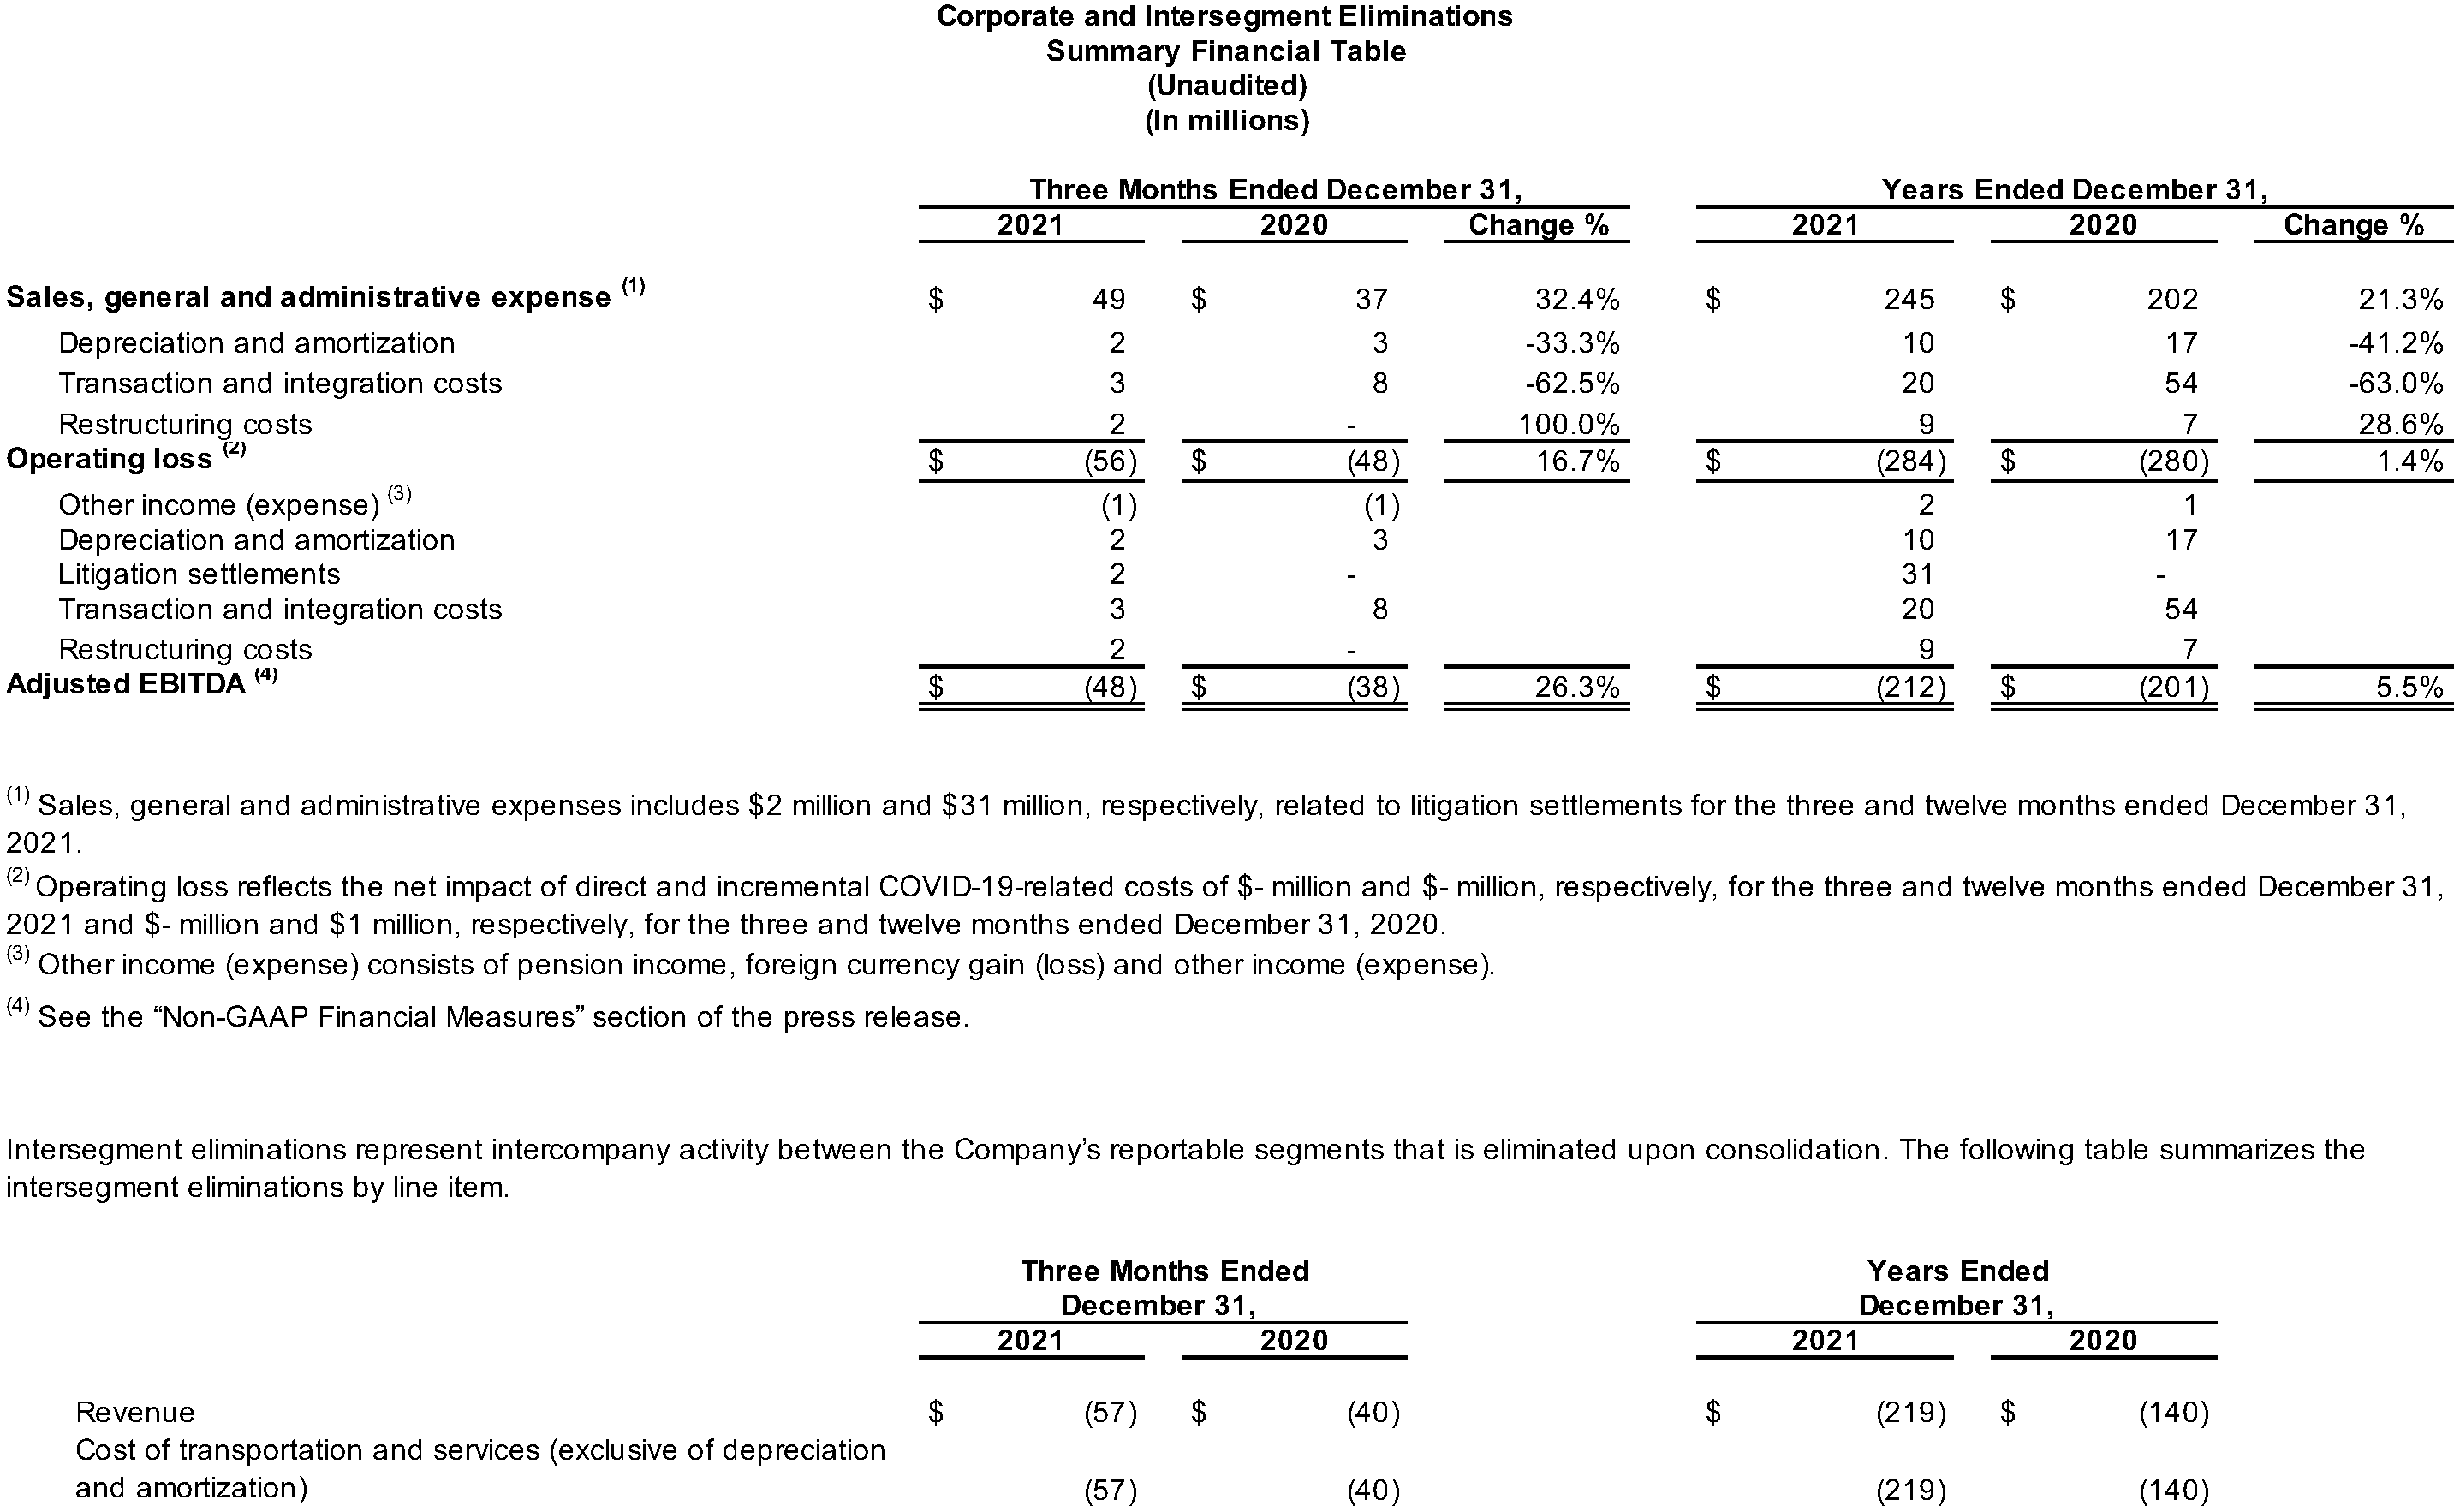
- Corporate: Corporate expense was $56 million for the fourth quarter 2021, compared with $48 million for the same period in 2020. Corporate adjusted EBITDA was an expense of $48 million for the fourth quarter 2021, compared with an expense of $38 million for the same period in 2020. The year-over-year changes in corporate expense and corporate adjusted EBITDA primarily reflect higher employee healthcare costs in 2021.
Full Year 2021 Financial Results
For the full year 2021, the company reported total revenue of $12.8 billion, compared with $10.2 billion for 2020. Net income from continuing operations attributable to common shareholders was $323 million for 2021, compared with a net loss from continuing operations attributable to common shareholders of $41 million for 2020. Operating income was $616 million for 2021, compared with $228 million for 2020. Diluted earnings from continuing operations per share was $2.82 for 2021, compared with a diluted loss from continuing operations per share of $0.45 for 2020. Income from continuing operations was $323 million for the full year 2021, compared with a loss of $13 million for the same period in 2020. Adjusted EBITDA for the full year 2021 was $1.24 billion, compared with $847 million for 2020.
Adjusted net income attributable to common shareholders for the full year 2021 was $491 million, compared with $92 million for the same period in 2020. Adjusted diluted earnings from continuing operations per share was $4.30 for 2021, compared with $1.01 for the same period in 2020.
Liquidity Position
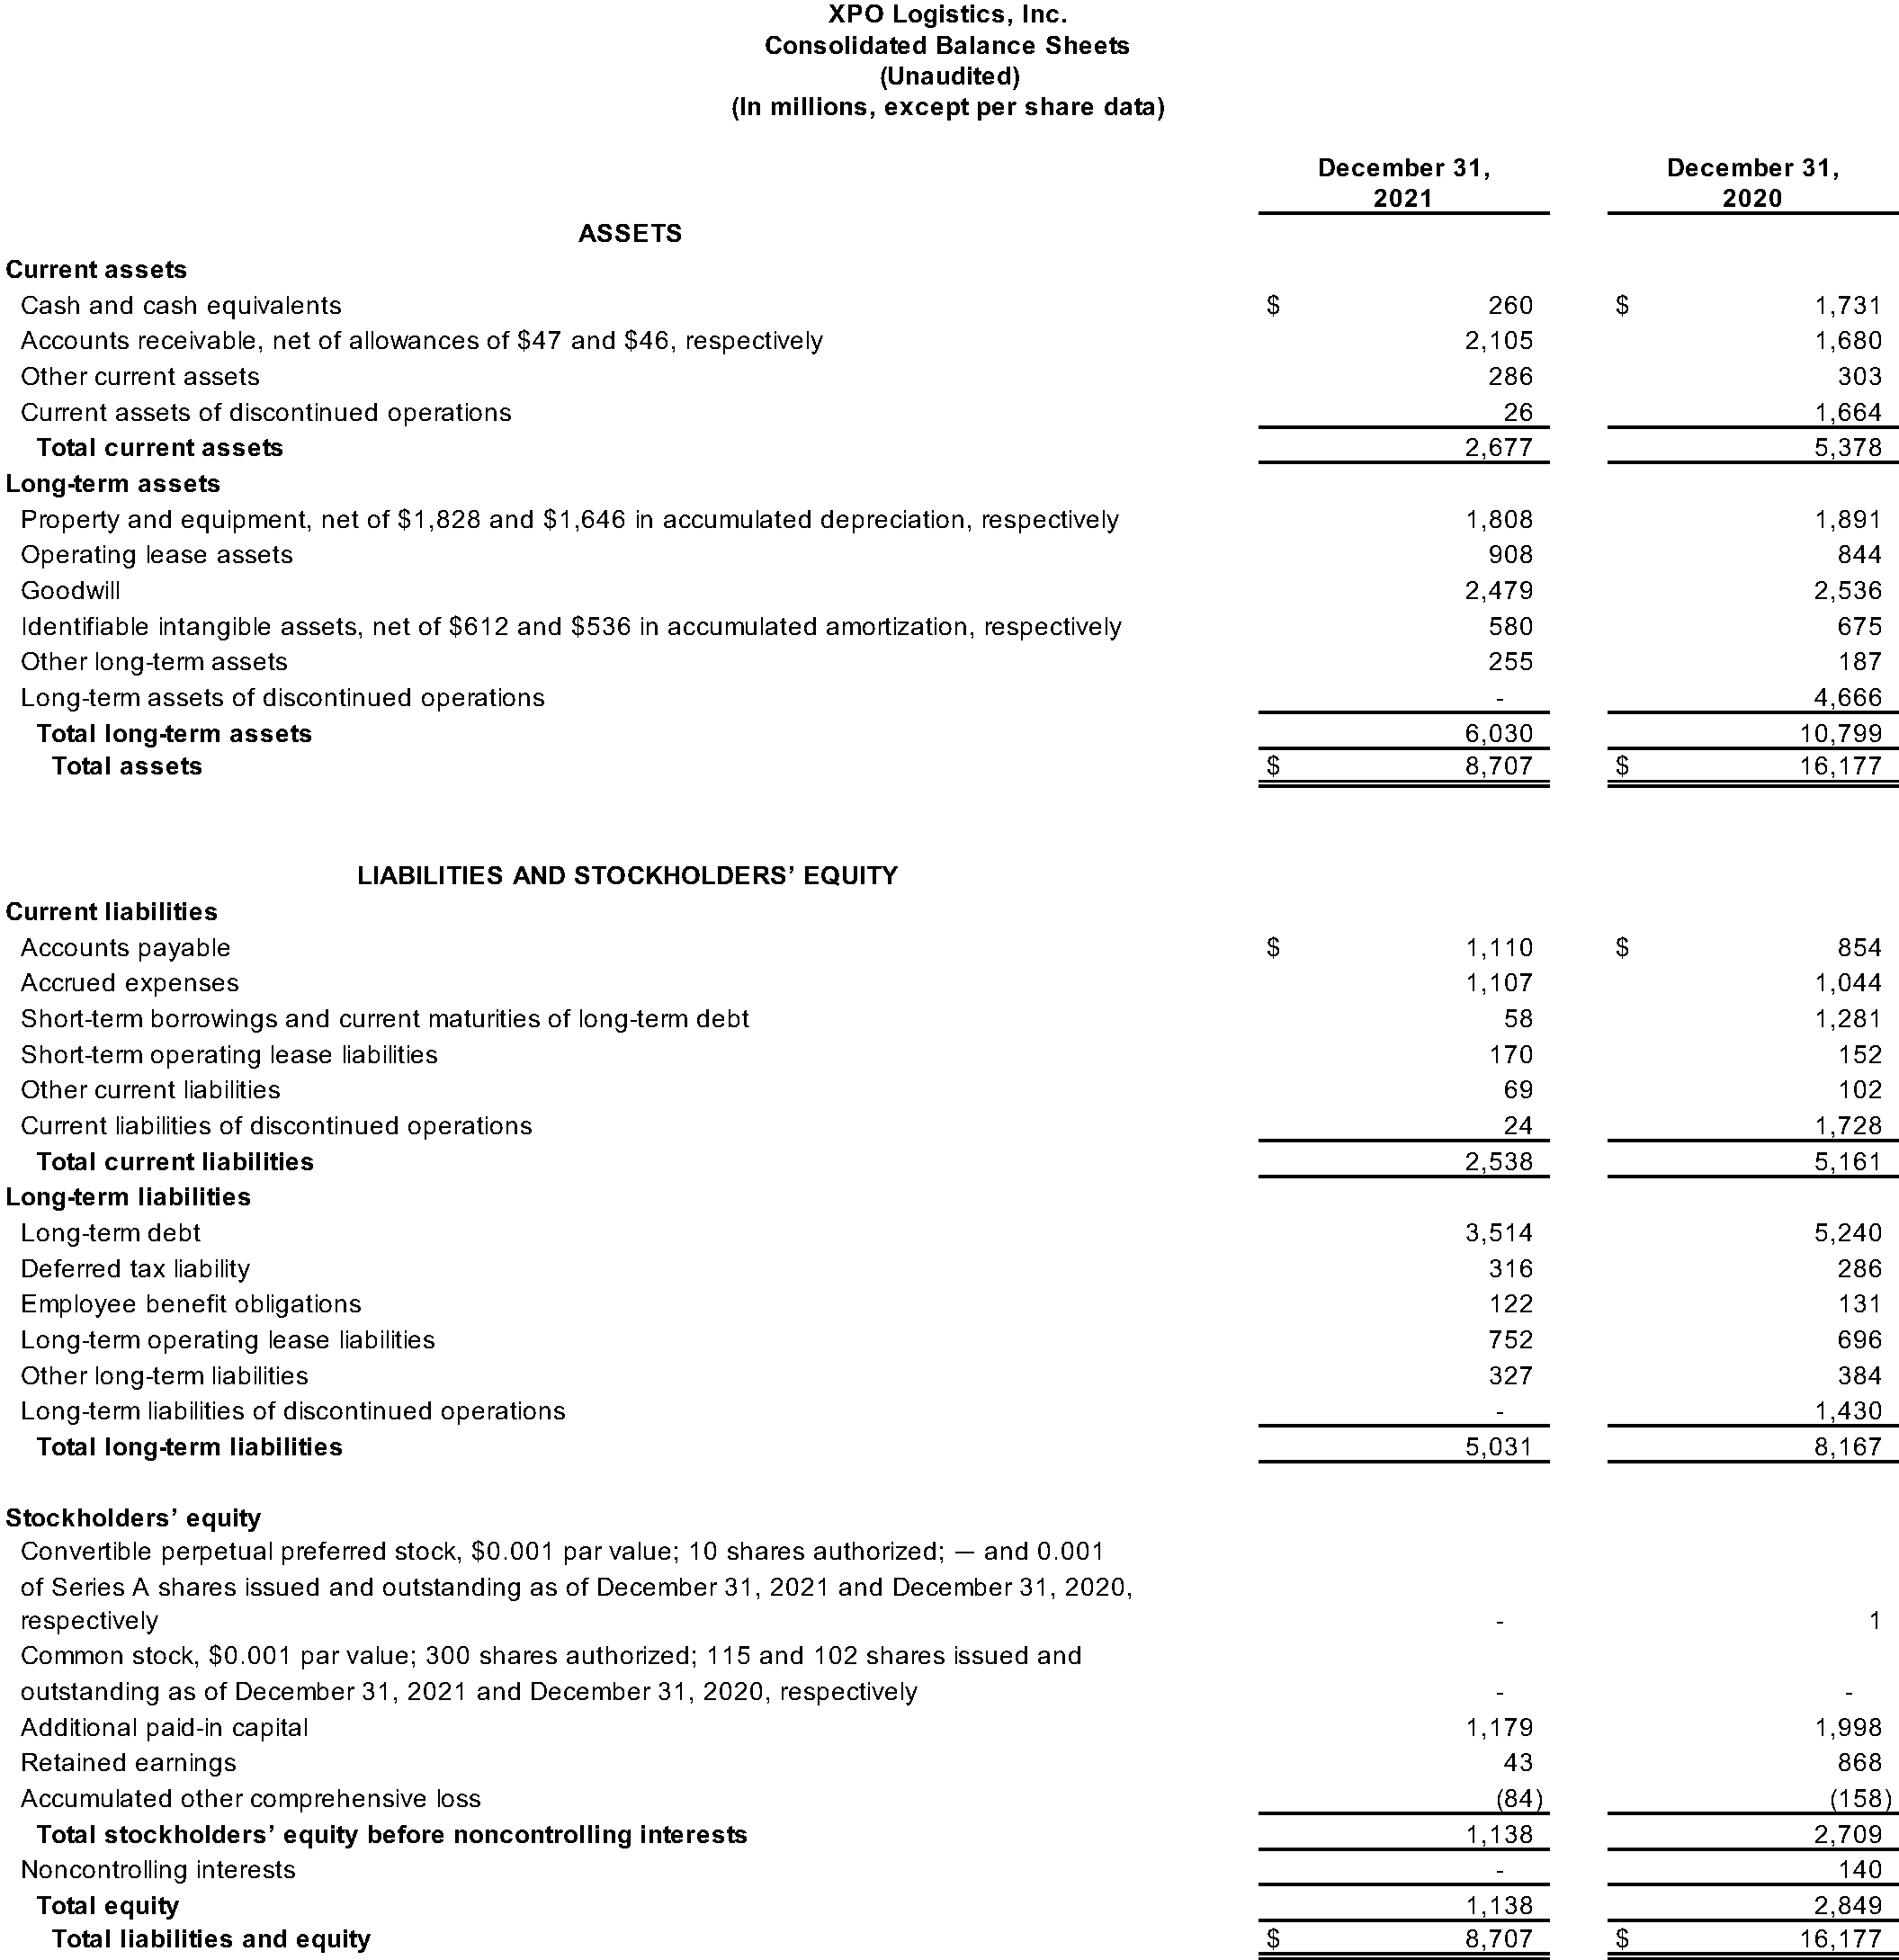
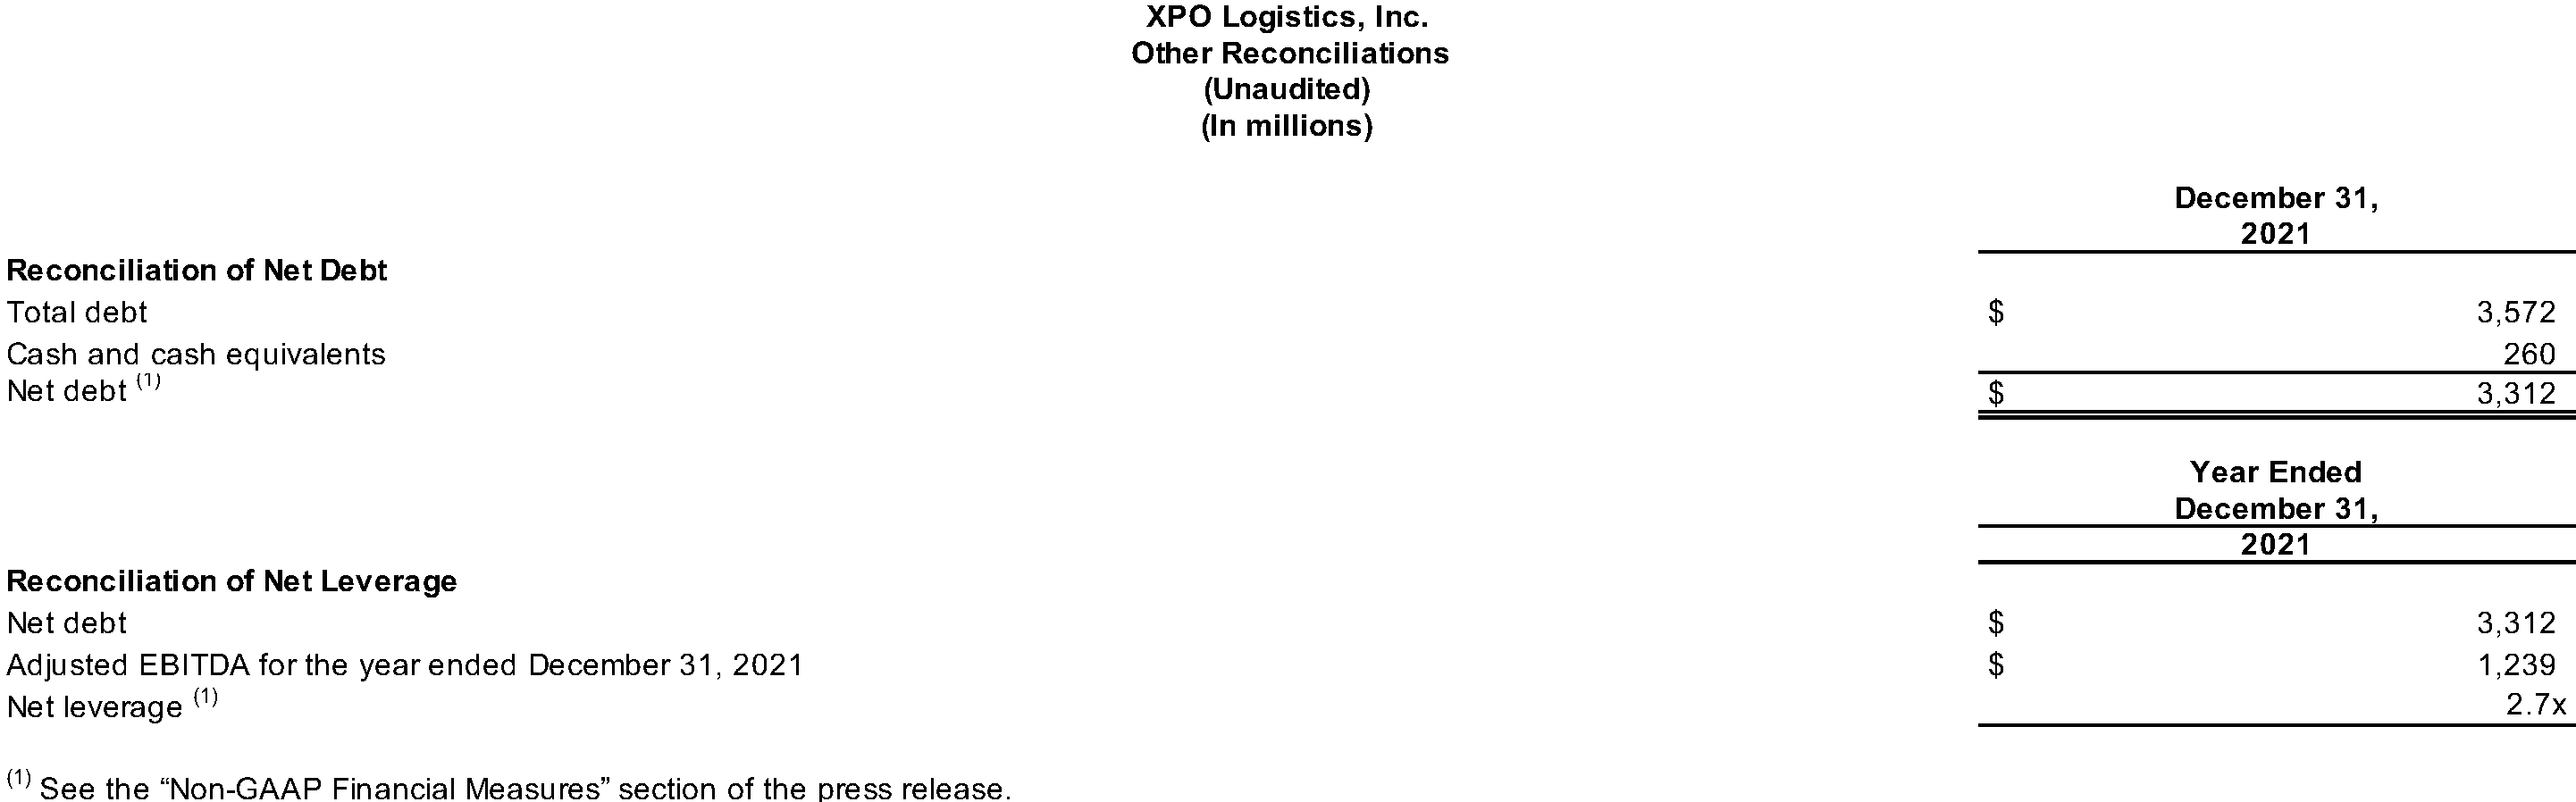
As of December 31, 2021, the company had $1.3 billion of total liquidity, including $260 million of cash and cash equivalents and approximately $1.0 billion of available borrowing capacity. Net leverage was 2.7x, calculated as net debt of $3.31 billion, divided by adjusted EBITDA of $1.24 billion for the year ended December 31, 2021.
The company is on track to deleverage to a net leverage ratio of 1.0x to 2.0x by the first half of 2023 and achieve its goal of an investment-grade credit rating.
Conference Call
The company will hold a conference call on Wednesday, February 9, 2022, at 8:30 a.m. Eastern Time. Participants can call toll-free (from US/Canada) 1-877-269-7756; international callers dial +1-201-689-7817. A live webcast of the conference will be available on the investor relations area of the company’s website, xpo.com/investors. The conference will be archived until March 9, 2022. To access the replay by phone, call toll-free (from US/Canada) 1-877-660-6853; international callers dial +1-201-612-7415. Use participant passcode 13726201.
About XPO Logistics
XPO Logistics, Inc. (NYSE: XPO) is a leading provider of freight transportation services, primarily truck brokerage and less-than-truckload (LTL). XPO uses its proprietary technology, including the cutting-edge XPO Connect® automated freight marketplace, to move goods efficiently through supply chains. The company’s global network serves 50,000 shippers with 771 locations and approximately 42,000 employees, and is headquartered in Greenwich, Conn., USA. Visit xpo.com and europe.xpo.com for more information, and connect with XPO on Facebook, Twitter, LinkedIn, Instagram and YouTube.
Non-GAAP Financial Measures
As required by the rules of the Securities and Exchange Commission (“SEC”), we provide reconciliations of the non-GAAP financial measures contained in this press release to the most directly comparable measure under GAAP, which are set forth in the financial tables attached to this press release.
XPO’s non-GAAP financial measures for the three months and twelve months ended December 31, 2021 and 2020 used in this press release include: adjusted earnings before interest, taxes, depreciation and amortization (“adjusted EBITDA”) on a consolidated basis and for corporate and intersegment eliminations; adjusted EBITDA margin on a consolidated basis; adjusted net income from continuing operations attributable to common shareholders and adjusted diluted earnings from continuing operations per share (“adjusted EPS”); margin (revenue less cost of transportation and services) and margin as a percentage of revenue (margin % of revenue) by service offering; free cash flows; adjusted operating income (including and excluding gains on real estate transactions) for our North American less-than-truckload segment; and adjusted operating ratio (including and excluding gains on real estate transactions) for our North American less-than-truckload segment. Also, XPO’s non-GAAP financial measures for the year ended December 31, 2021 include net leverage and net debt.
We believe that the above adjusted financial measures facilitate analysis of our ongoing business operations because they exclude items that may not be reflective of, or are unrelated to, XPO and its business segments’ core operating performance, and may assist investors with comparisons to prior periods and assessing trends in our underlying businesses. Other companies may calculate these non-GAAP financial measures differently, and therefore our measures may not be comparable to similarly titled measures of other companies. These non-GAAP financial measures should only be used as supplemental measures of our operating performance.
Adjusted EBITDA, adjusted net income from continuing operations attributable to common shareholders and adjusted EPS include adjustments for transaction and integration costs, as well as restructuring costs, litigation settlements and other adjustments as set forth in the attached tables. Transaction and integration adjustments are generally incremental costs that result from an actual or planned acquisition, divestiture or spin-off and may include transaction costs, consulting fees, retention awards, and internal salaries and wages (to the extent the individuals are assigned full-time to integration and transformation activities) and certain costs related to integrating and converging IT systems. Restructuring costs primarily relate to severance costs associated with business optimization initiatives. Management uses these non-GAAP financial measures in making financial, operating and planning decisions and evaluating XPO’s and each business segment’s ongoing performance.
We believe that free cash flow is an important measure of our ability to repay maturing debt or fund other uses of capital that we believe will enhance stockholder value. We calculate free cash flow as net cash provided by operating activities from continuing operations, less payment for purchases of property and equipment plus proceeds from sale of property and equipment. We believe that adjusted EBITDA and adjusted EBITDA margin improve comparability from period to period by removing the impact of our capital structure (interest and financing expenses), asset base (depreciation and amortization), litigation settlements, tax impacts and other adjustments as set out in the attached tables that management has determined are not reflective of core operating activities and thereby assist investors with assessing trends in our underlying businesses. We believe that adjusted net income from continuing operations attributable to common shareholders and adjusted EPS improve the comparability of our operating results from period to period by removing the impact of certain costs and gains that management has determined are not reflective of our core operating activities, including amortization of acquisition-related intangible assets, litigation settlements, transaction and integration costs, restructuring costs and other adjustments as set out in the attached tables. We believe that margin (revenue less cost of transportation and services) and margin as a percentage of revenue (margin % of revenue) improve the comparability of our operating results from period to period by removing the cost of transportation and services, in particular the cost of fuel, incurred in the reporting period as set out in the attached tables. We believe that adjusted operating income and adjusted operating ratio improve the comparability of our operating results from period to period by (i) removing the impact of certain transaction and integration costs and restructuring costs, as well as amortization expenses and (ii) including the impact of pension income incurred in the reporting period as set out in the attached tables. We believe that net leverage and net debt are important measures of our overall liquidity position and are calculated by removing cash and cash equivalents from our reported total debt and reporting net debt as a ratio of our last twelve-month reported adjusted EBITDA.
With respect to our financial targets for full year 2022 adjusted EBITDA, adjusted diluted EPS and free cash flow, a reconciliation of these non-GAAP measures to the corresponding GAAP measures is not available without unreasonable effort due to the variability and complexity of the reconciling items described above that we exclude from these non-GAAP target measures. The variability of these items may have a significant impact on our future GAAP financial results and, as a result, we are unable to prepare the forward-looking statement of income and statement of cash flows prepared in accordance with GAAP that would be required to produce such a reconciliation.
Forward-looking Statements
This release includes forward-looking statements within the meaning of Section 27A of the Securities Act of 1933, as amended, and Section 21E of the Securities Exchange Act of 1934, as amended, including our full year 2022 financial targets for adjusted EBITDA, depreciation and amortization (excluding amortization of acquisition-related intangible assets), interest expense, effective tax rate, adjusted diluted EPS (excluding amortization of acquisition-related intangible assets), gross capital expenditures, net capital expenditures, and free cash flow; our first quarter 2022 financial target for adjusted EBITDA; our expectation of year-over-year improvement of more than 100 basis points in North American LTL adjusted operating ratio; our 2022 financial target of at least $1 billion of adjusted EBITDA in the North American LTL segment; our expectation that North American LTL adjusted operating ratio will inflect to year-over-year improvement mid-year 2022, our expectation to continue to deliver double-digit volume growth in North American truck brokerage in 2022 and going forward; our target net leverage ratio of 1.0x to 2.0x by the first half of 2023; and our goal of an investment-grade credit rating. All statements other than statements of historical fact are, or may be deemed to be, forward-looking statements. In some cases, forward-looking statements can be identified by the use of forward-looking terms such as “anticipate,” “estimate,” “believe,” “continue,” “could,” “intend,” “may,” “plan,” “potential,” “predict,” “should,” “will,” “expect,” “objective,” “projection,” “forecast,” “goal,” “guidance,” “outlook,” “effort,” “target,” “trajectory” or the negative of these terms or other comparable terms. However, the absence of these words does not mean that the statements are not forward-looking. These forward-looking statements are based on certain assumptions and analyses made by us in light of our experience and our perception of historical trends, current conditions and expected future developments, as well as other factors we believe are appropriate in the circumstances.
These forward-looking statements are subject to known and unknown risks, uncertainties and assumptions that may cause actual results, levels of activity, performance or achievements to be materially different from any future results, levels of activity, performance or achievements expressed or implied by such forward-looking statements. Factors that might cause or contribute to a material difference include the risks discussed in our filings with the SEC and the following: economic conditions generally; the severity, magnitude, duration and aftereffects of the COVID-19 pandemic, including supply chain disruptions due to plant and port shutdowns and transportation delays, the global shortage of certain components such as semiconductor chips, strains on production or extraction of raw materials, cost inflation and labor and equipment shortages, which may lower levels of service, including the timeliness, productivity and quality of service, and government responses to these factors; our ability to align our investments in capital assets, including equipment, service centers and warehouses, to our customers’ demands; our ability to implement our cost and revenue initiatives; the effectiveness of our action plan, and other management actions, to improve our North American LTL business; our ability to benefit from a sale, spinoff or other divestiture of one or more business units, and the impact of anticipated material compensation and other expenses, including expenses related to the acceleration of equity awards, to be incurred in connection with a substantial disposition; our ability to successfully integrate and realize anticipated synergies, cost savings and profit improvement opportunities with respect to acquired companies; goodwill impairment, including in connection with a business unit sale, spinoff or other divestiture; matters related to our intellectual property rights; fluctuations in currency exchange rates; fuel price and fuel surcharge changes; natural disasters, terrorist attacks or similar incidents; risks and uncertainties regarding the expected benefits of the spin-off of our logistics segment; the impact of the spin-off of our logistics segment or a future spin-off of a business unit on the size and business diversity of our company; the ability of the spin-off of our logistics segment to qualify for tax-free treatment for U.S. federal income tax purposes; our ability to develop and implement suitable information technology systems and prevent failures in or breaches of such systems; our indebtedness; our ability to raise debt and equity capital; fluctuations in fixed and floating interest rates; our ability to maintain positive relationships with our network of third-party transportation providers; our ability to attract and retain qualified drivers; labor matters, including our ability to manage our subcontractors, and risks associated with labor disputes at our customers and efforts by labor organizations to organize our employees and independent contractors; litigation, including litigation related to alleged misclassification of independent contractors and securities class actions; risks associated with our self-insured claims; risks associated with defined benefit plans for our current and former employees; governmental regulation, including trade compliance laws, as well as changes in international trade policies and tax regimes; governmental or political actions, including the United Kingdom’s exit from the European Union; and competition and pricing pressures.
All forward-looking statements set forth in this release are qualified by these cautionary statements and there can be no assurance that the actual results or developments anticipated by us will be realized or, even if substantially realized, that they will have the expected consequences to or effects on us or our business or operations. Forward-looking statements set forth in this release speak only as of the date hereof, and we do not undertake any obligation to update forward-looking statements to reflect subsequent events or circumstances, changes in expectations or the occurrence of unanticipated events, except to the extent required by law.