XPO Reports Third Quarter 2023 Results
XPO (NYSE: XPO) today announced its financial results for the third quarter 2023, reflecting a solid performance in a soft industry environment for freight transportation. The company reported diluted earnings from continuing operations per share of $0.72 and adjusted diluted earnings from continuing operations per share of $0.88.
Mario Harik, chief executive officer of XPO, said, “Our third quarter results exceeded expectations, with solid growth in revenue and profitability, and strong forward momentum. We delivered year-over-year revenue growth of 2%, and adjusted EBITDA growth of 6%, with 50 basis points of adjusted EBITDA margin expansion.
“In North American LTL, we’re improving every aspect of the business that impacts customer service and value creation. Our third quarter adjusted operating ratio of 86.2% improved sequentially by 140 basis points, and outpaced seasonality by 370 basis points. This was driven by gains in volume, pricing and labor productivity. Our damage claims ratio was a company-best 0.4% — a significant improvement from 1.2% two years ago, when we launched our LTL 2.0 plan.
“We also captured more share in the quarter, as customers responded to our focus on service and investments in capacity. Our yield growth, excluding fuel, accelerated to 6.4%, reflecting the benefit of numerous pricing initiatives underway. We expect to further accelerate yield growth in the fourth quarter.”
Harik continued “It’s exciting to take large steps forward across the business as we execute our plan. We’re making excellent progress, and I’m confident that we’re still in the early innings of realizing XPO’s full potential.”
Third Quarter Highlights
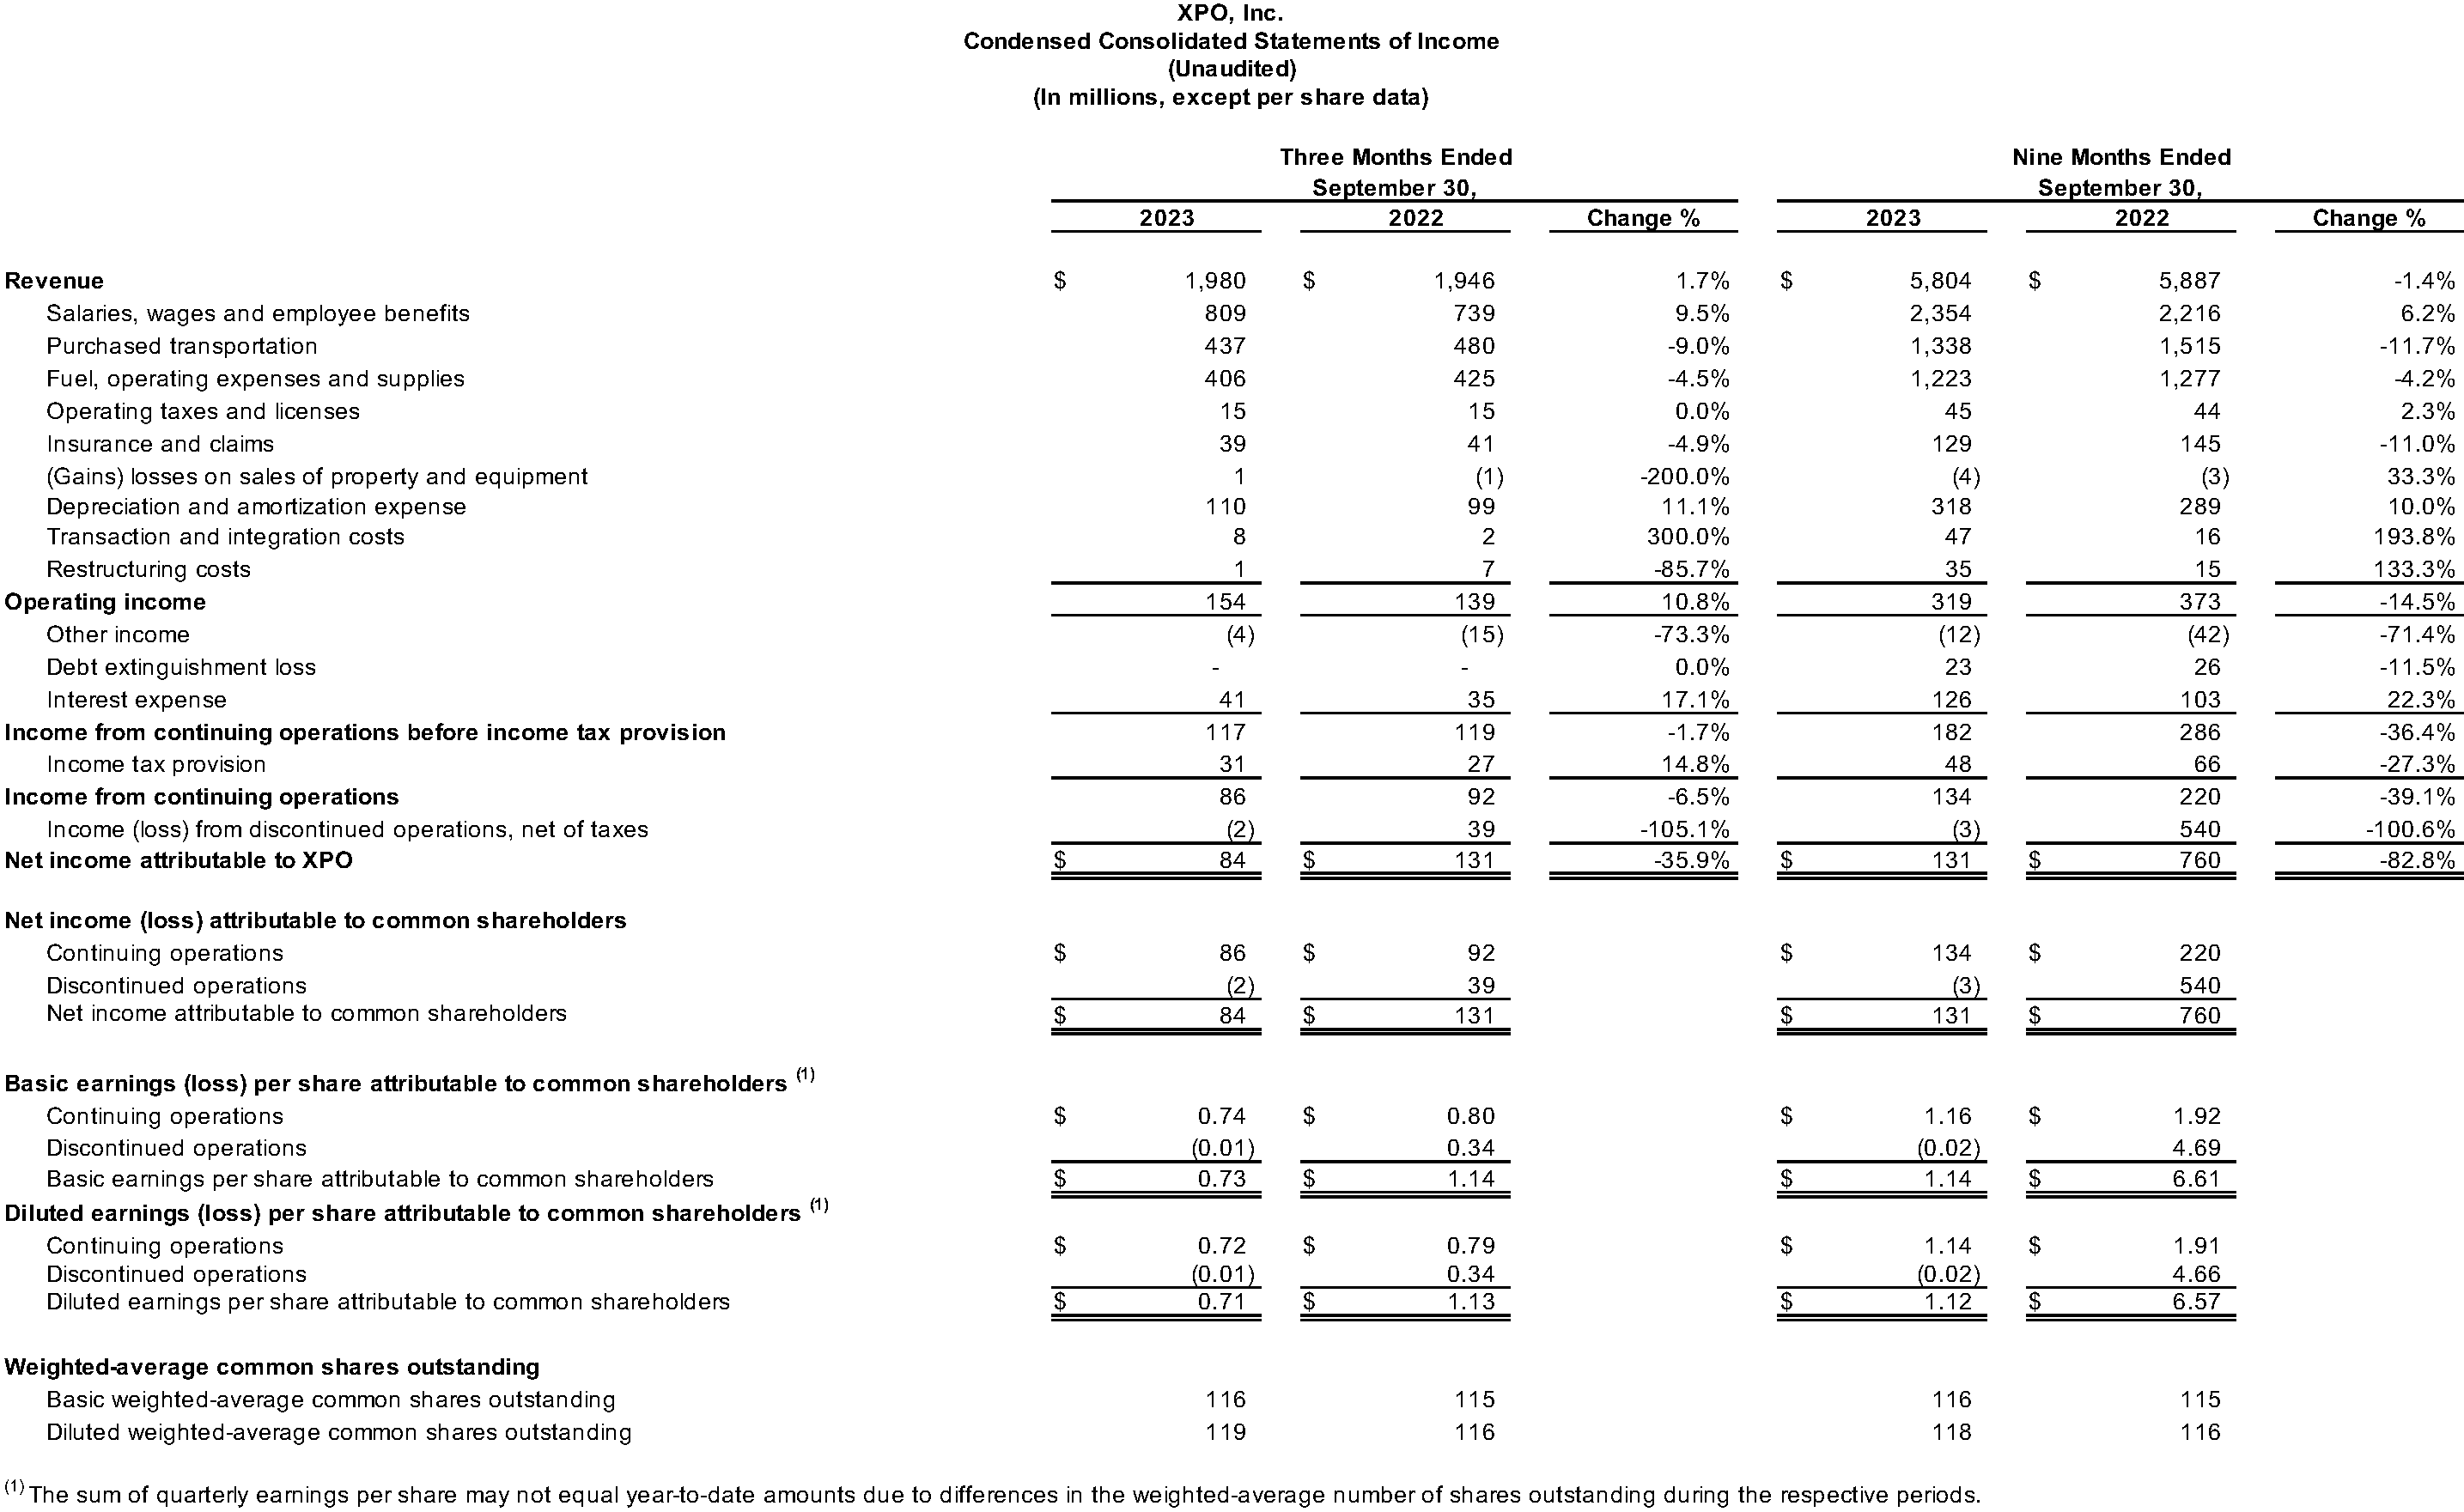
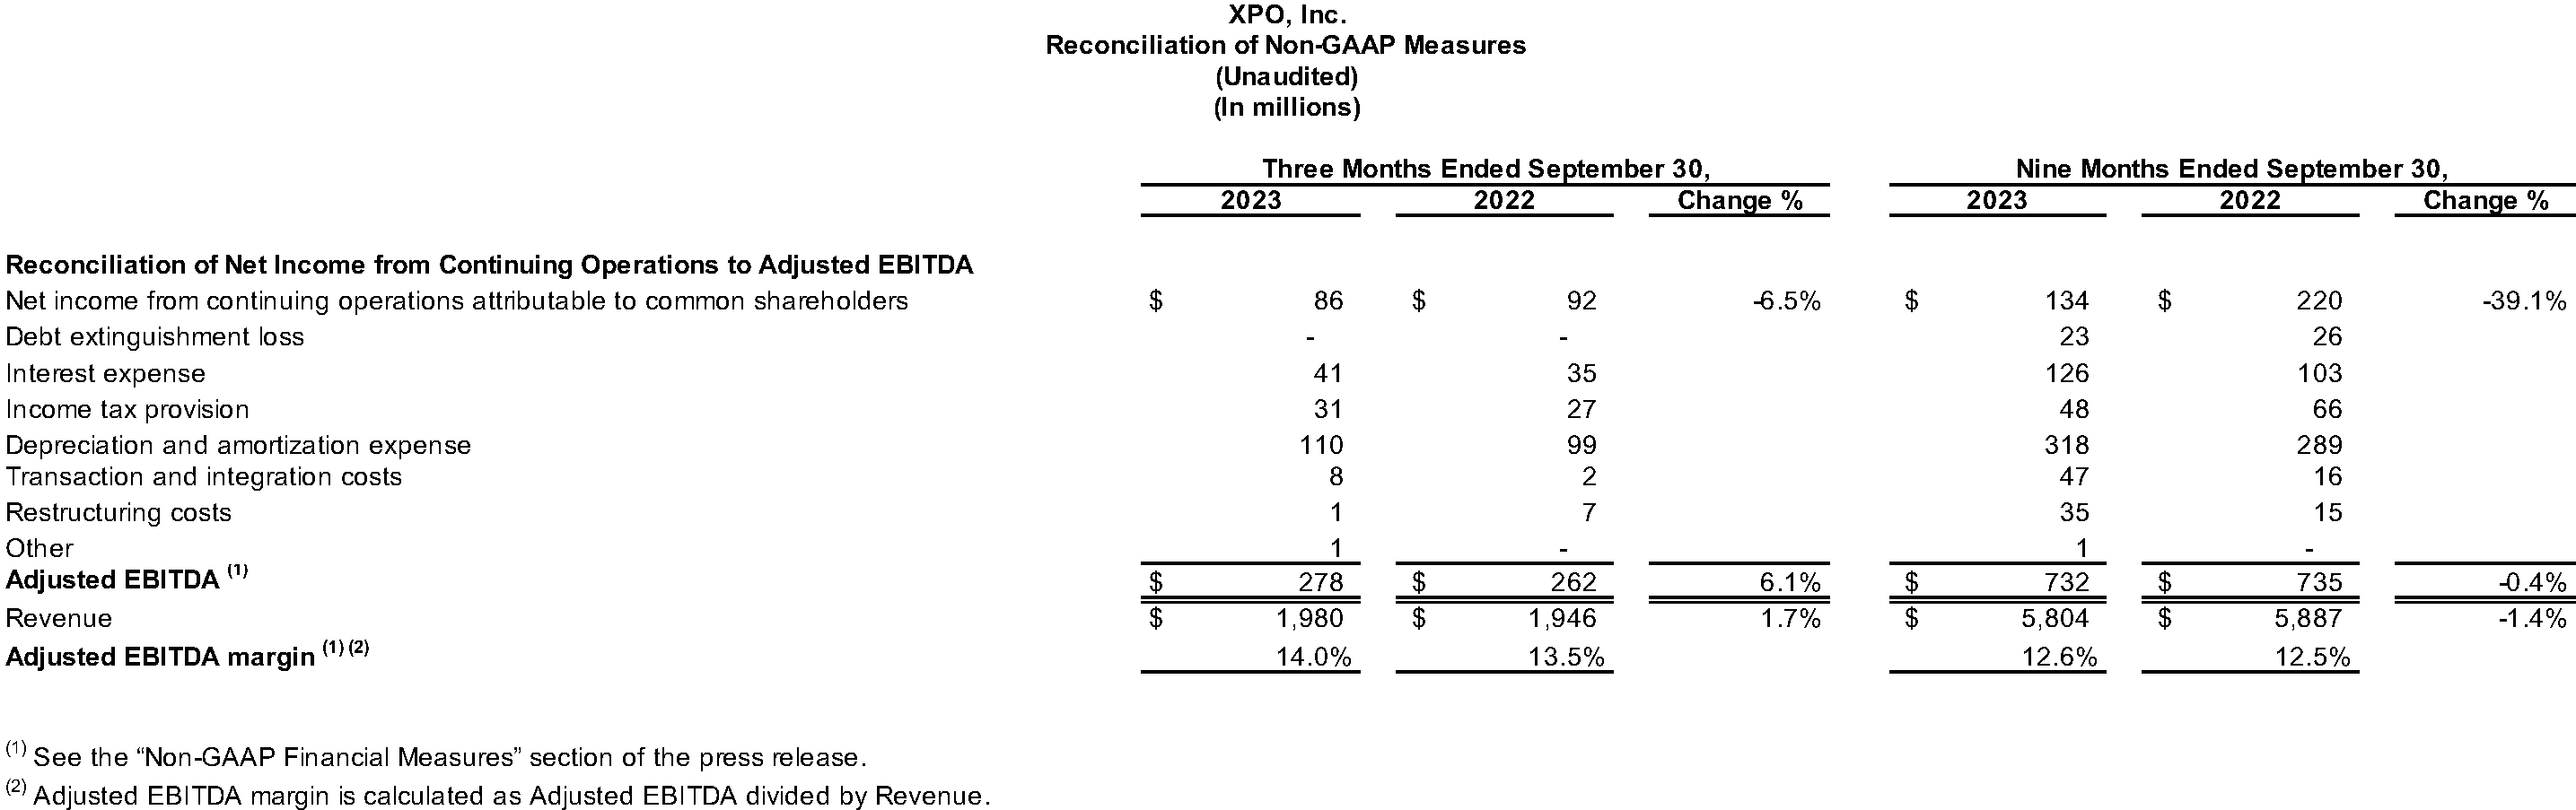
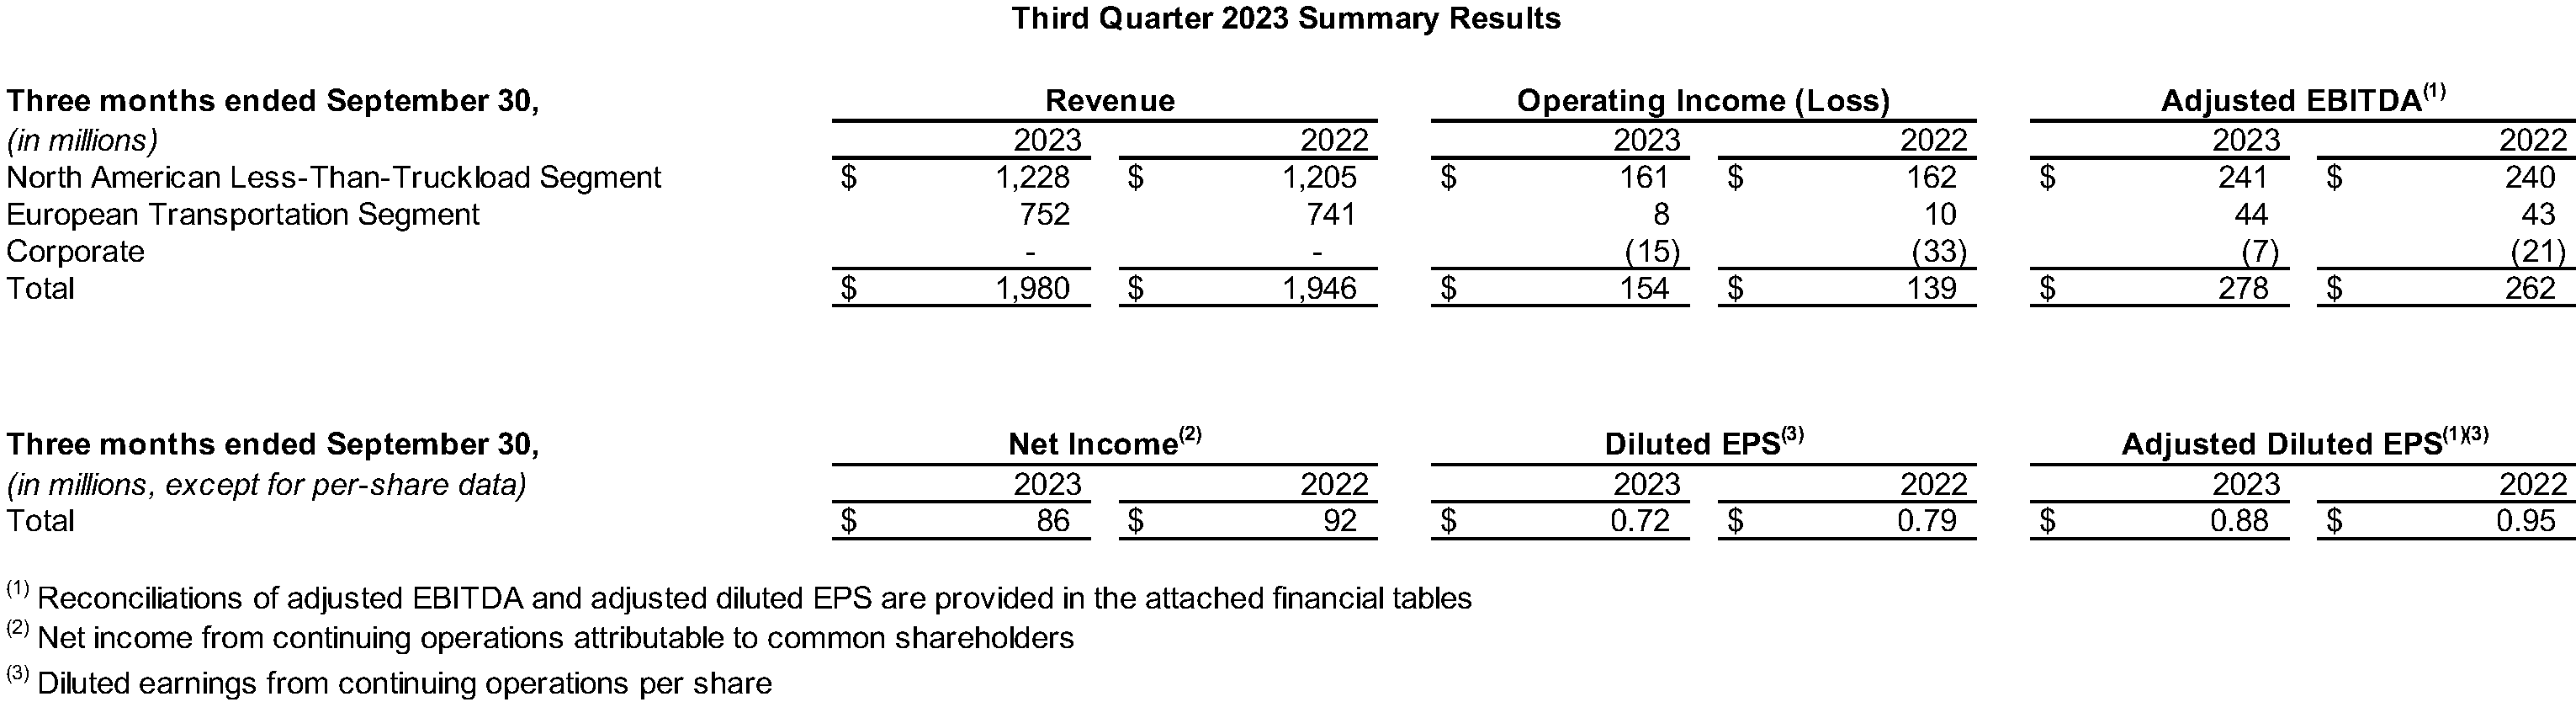
For the third quarter 2023, revenue was $1.98 billion, compared to $1.95 billion for the same period in 2022. The year-over-year increase in revenue was due primarily to higher tonnage per day and yield, excluding fuel, in the North American LTL segment, partially offset by lower fuel surcharge revenue.
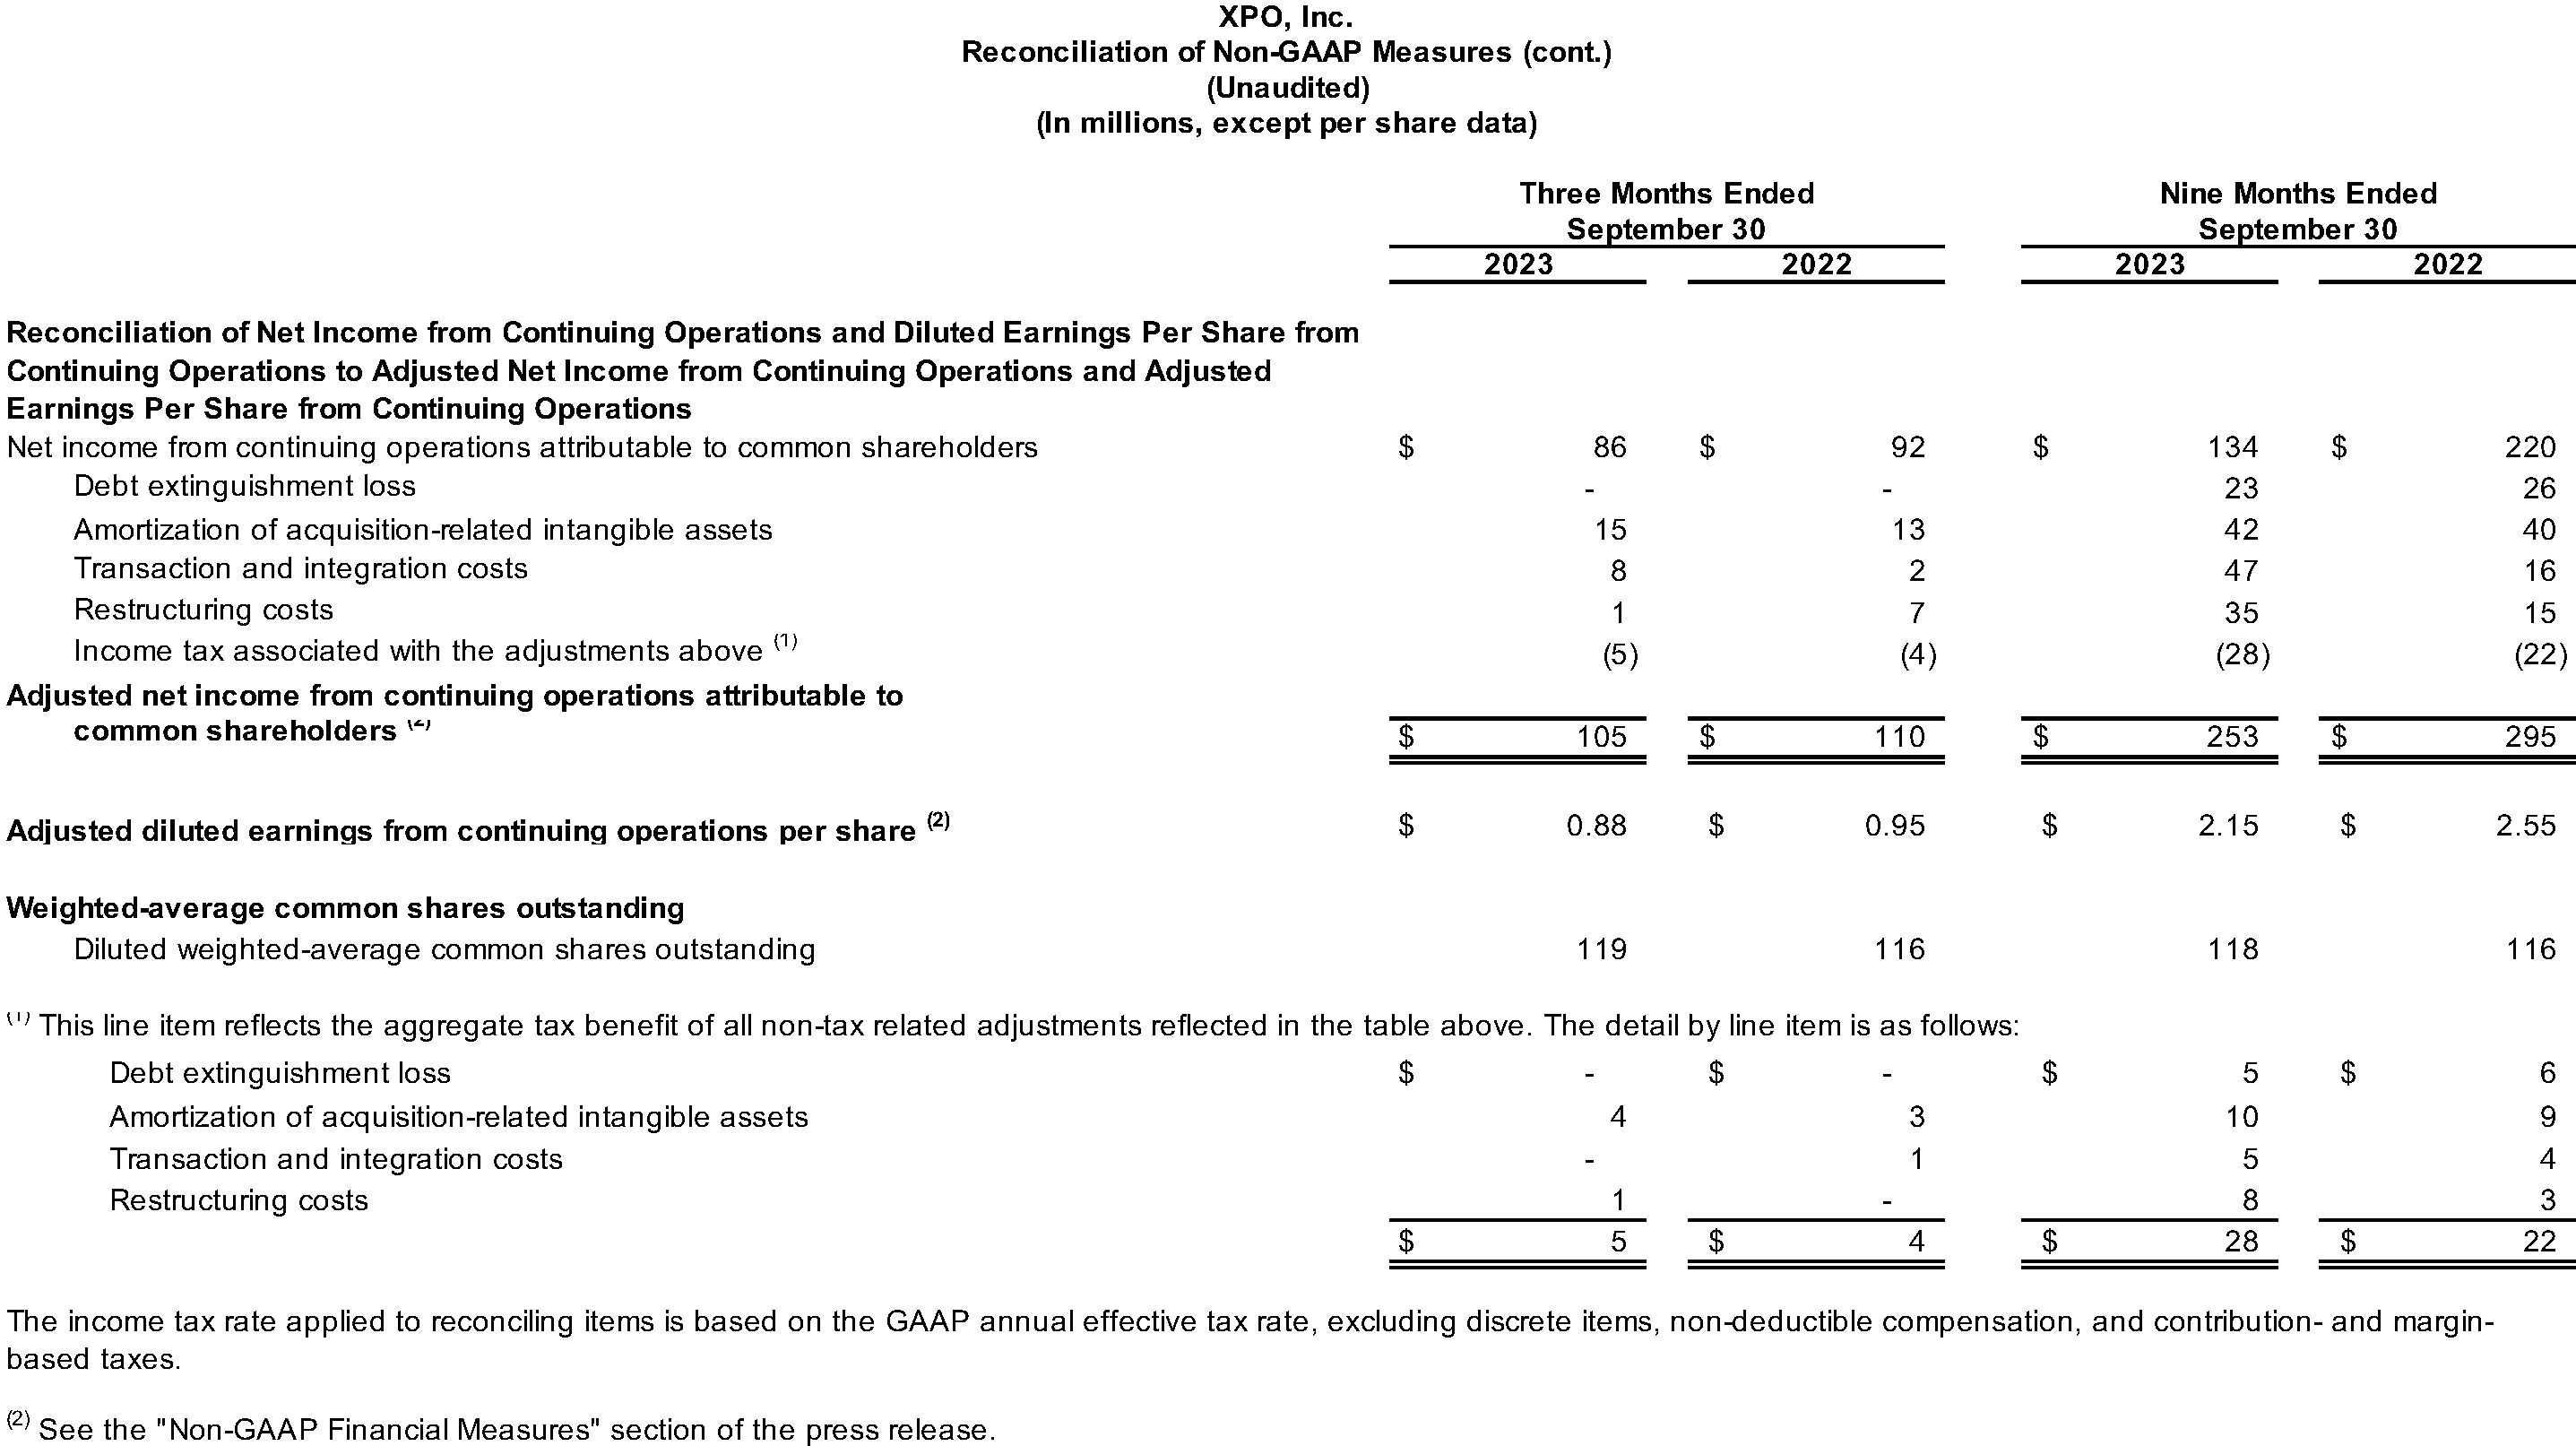
Net income from continuing operations attributable to common shareholders was $86 million for the third quarter 2023, compared with $92 million for the same period in 2022. Operating income was $154 million for the third quarter, compared with $139 million for the same period in 2022. Diluted earnings from continuing operations per share was $0.72 for the third quarter, compared with $0.79 for the same period in 2022.
Adjusted net income from continuing operations attributable to common shareholders, a non-GAAP financial measure, was $105 million for the third quarter, compared with $110 million for the same period in 2022. Adjusted diluted earnings from continuing operations per share (“adjusted diluted EPS”), a non-GAAP financial measure, was $0.88 for the third quarter, compared with $0.95 for the same period in 2022.
Adjusted earnings before interest, taxes, depreciation and amortization (“adjusted EBITDA”), a non-GAAP financial measure, was $278 million for the third quarter, compared with $262 million for the same period in 2022.
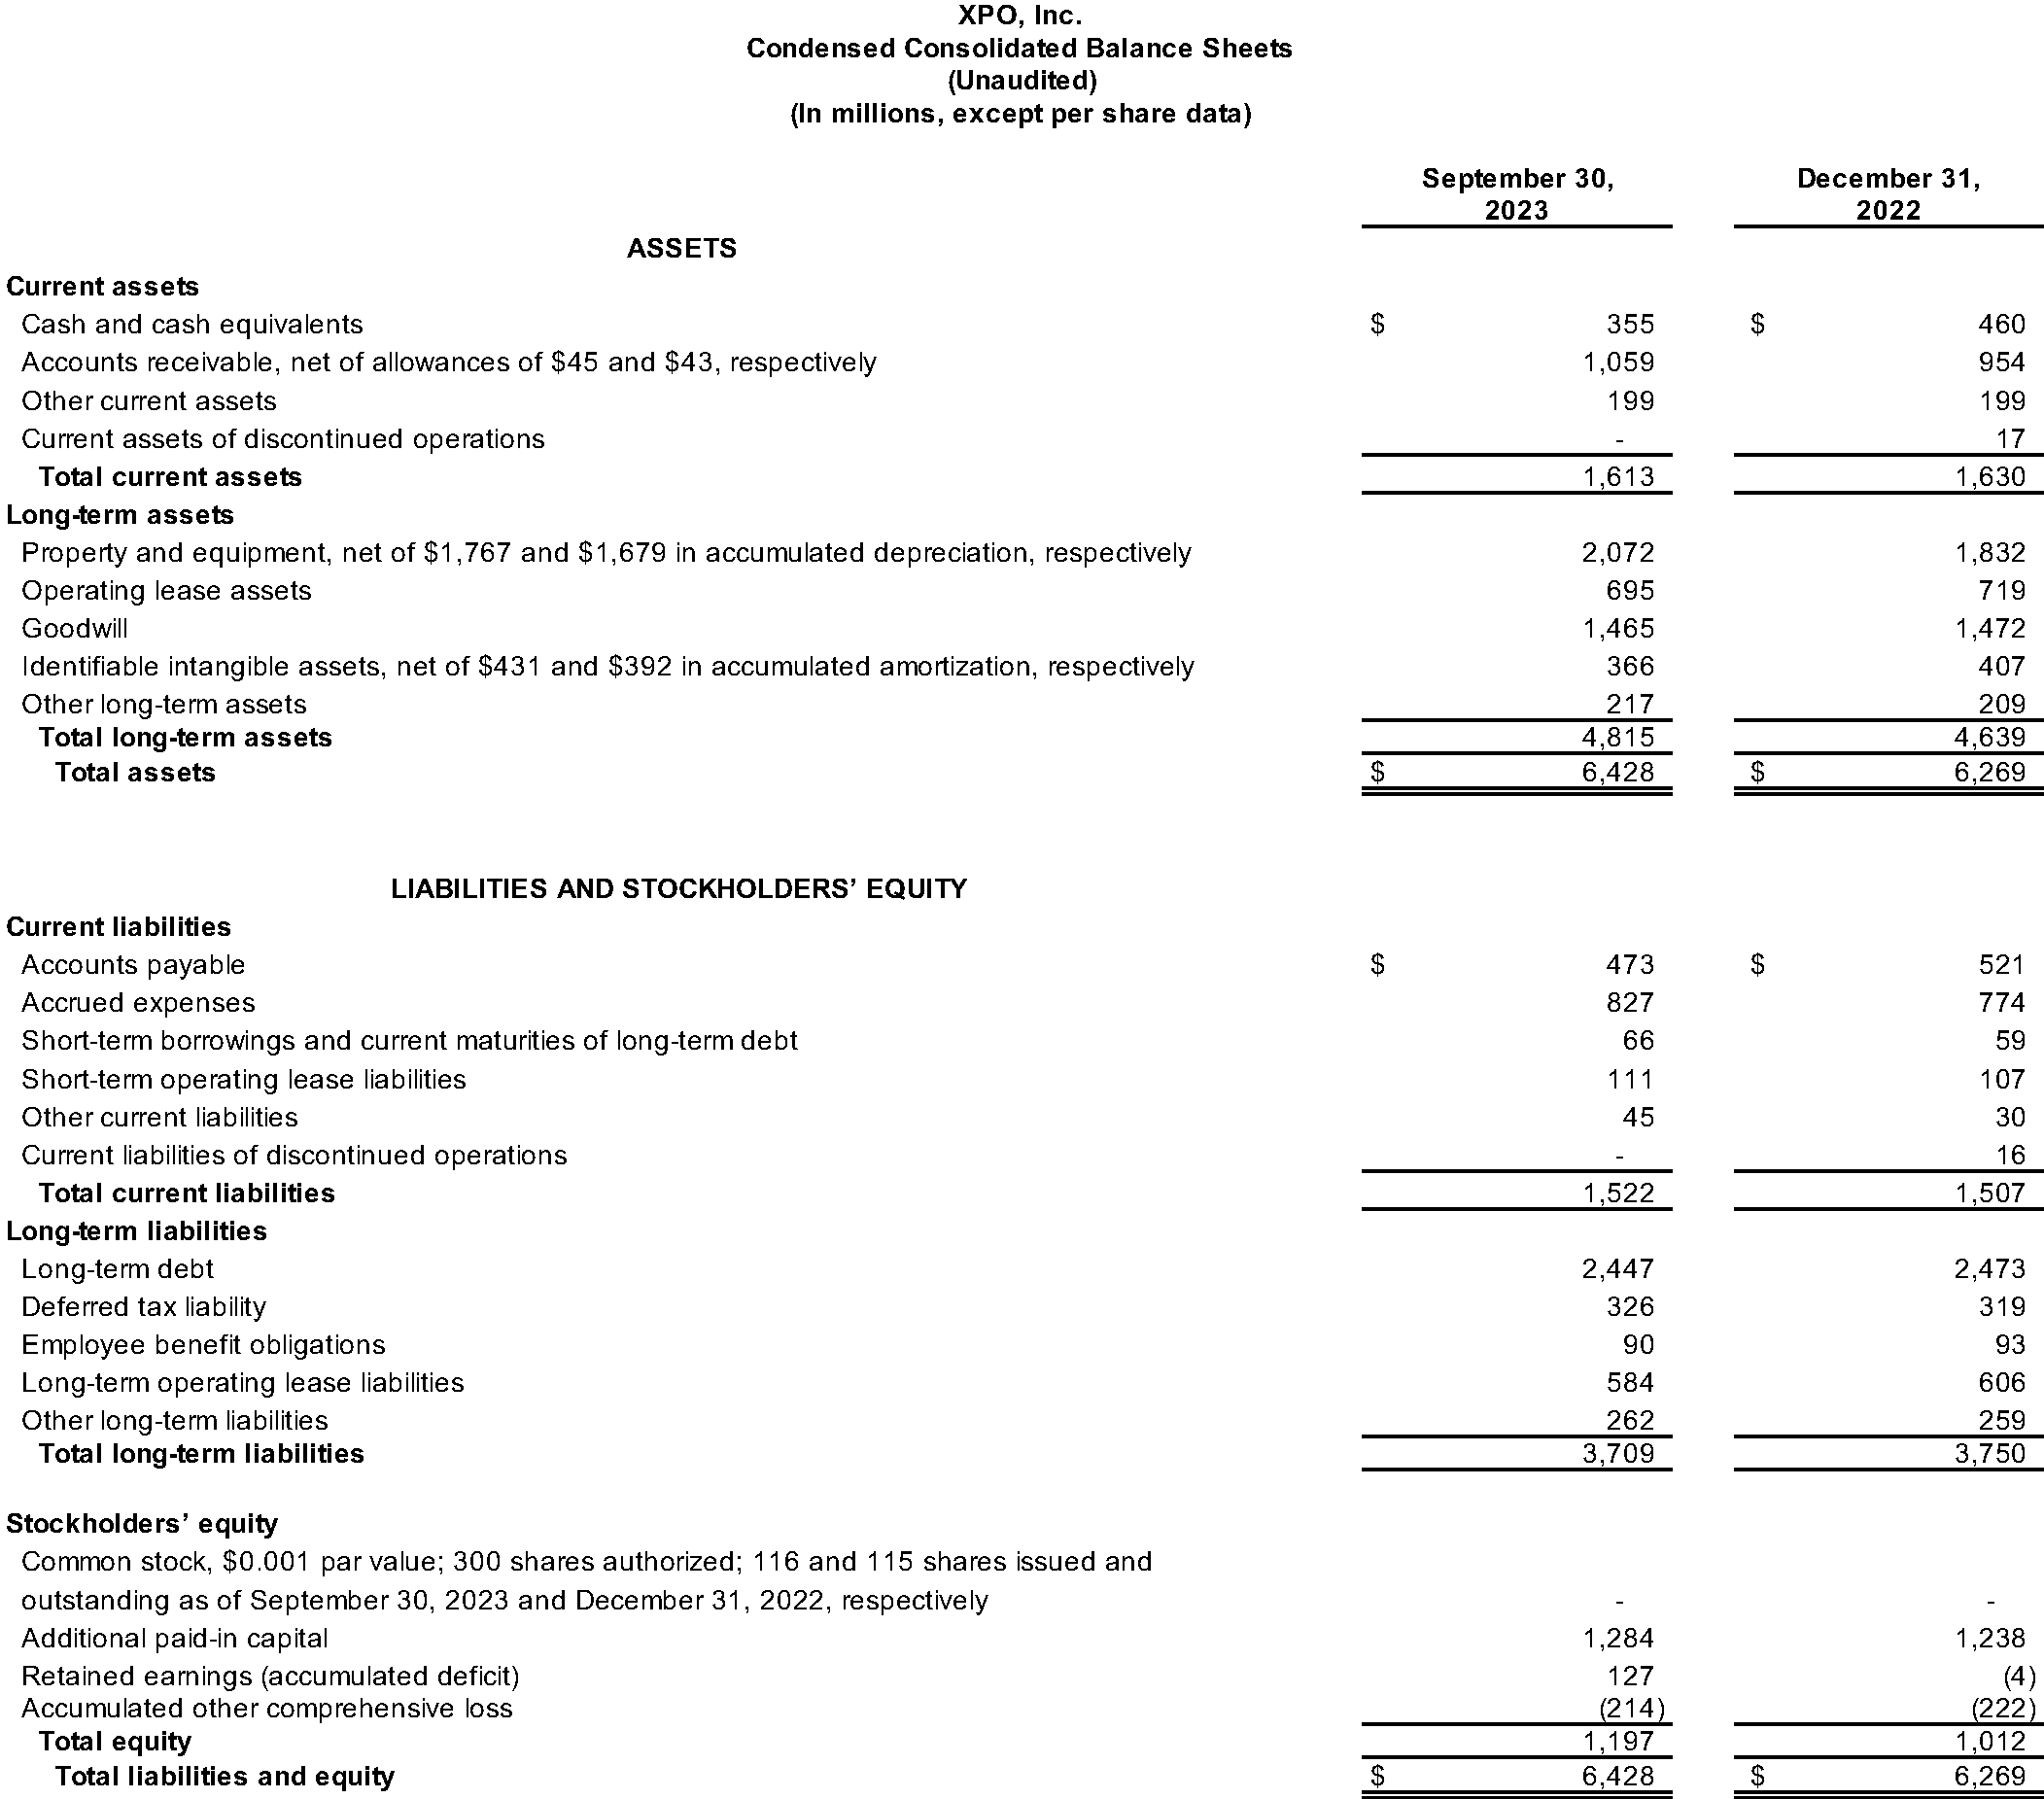
The company generated $236 million of cash flow from operating activities in the third quarter, and ended the quarter with $355 million of cash and cash equivalents on hand, after $133 million of net capital expenditures.
Reconciliations of non-GAAP financial measures in this press release are provided in the attached financial tables. Seasonality is compared to the same period for the past five years excluding 2020.
Results by Business Segment
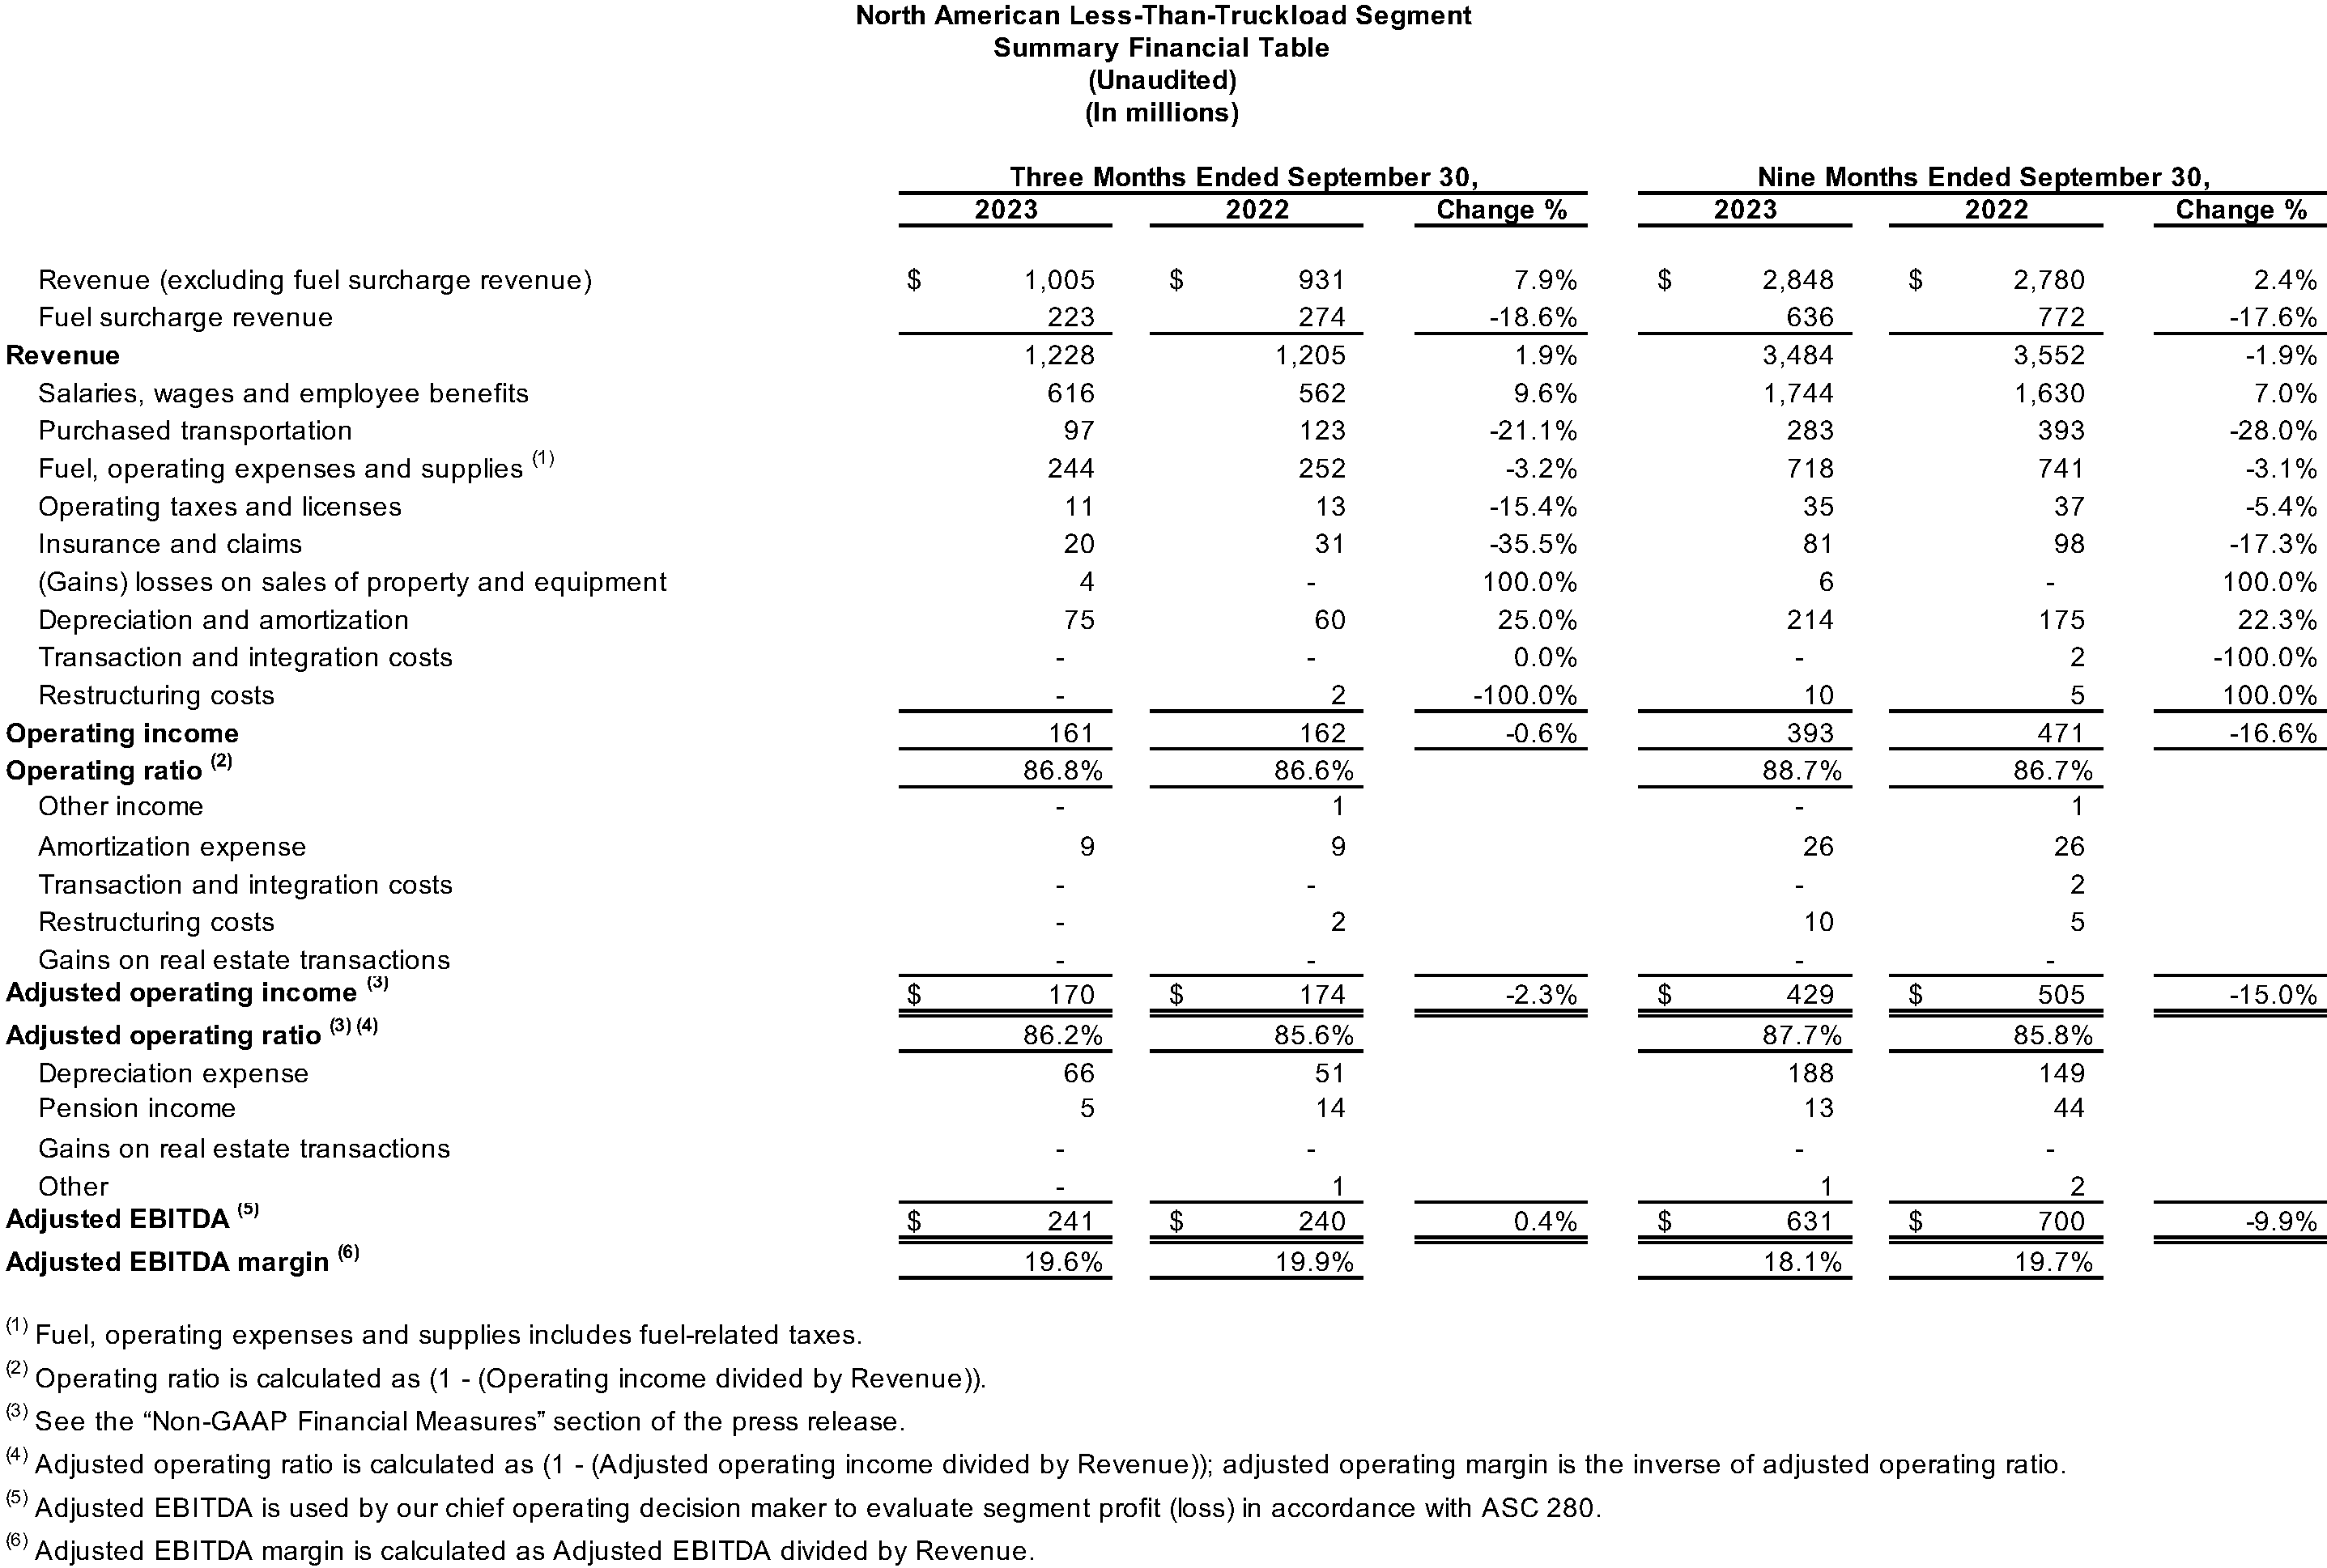
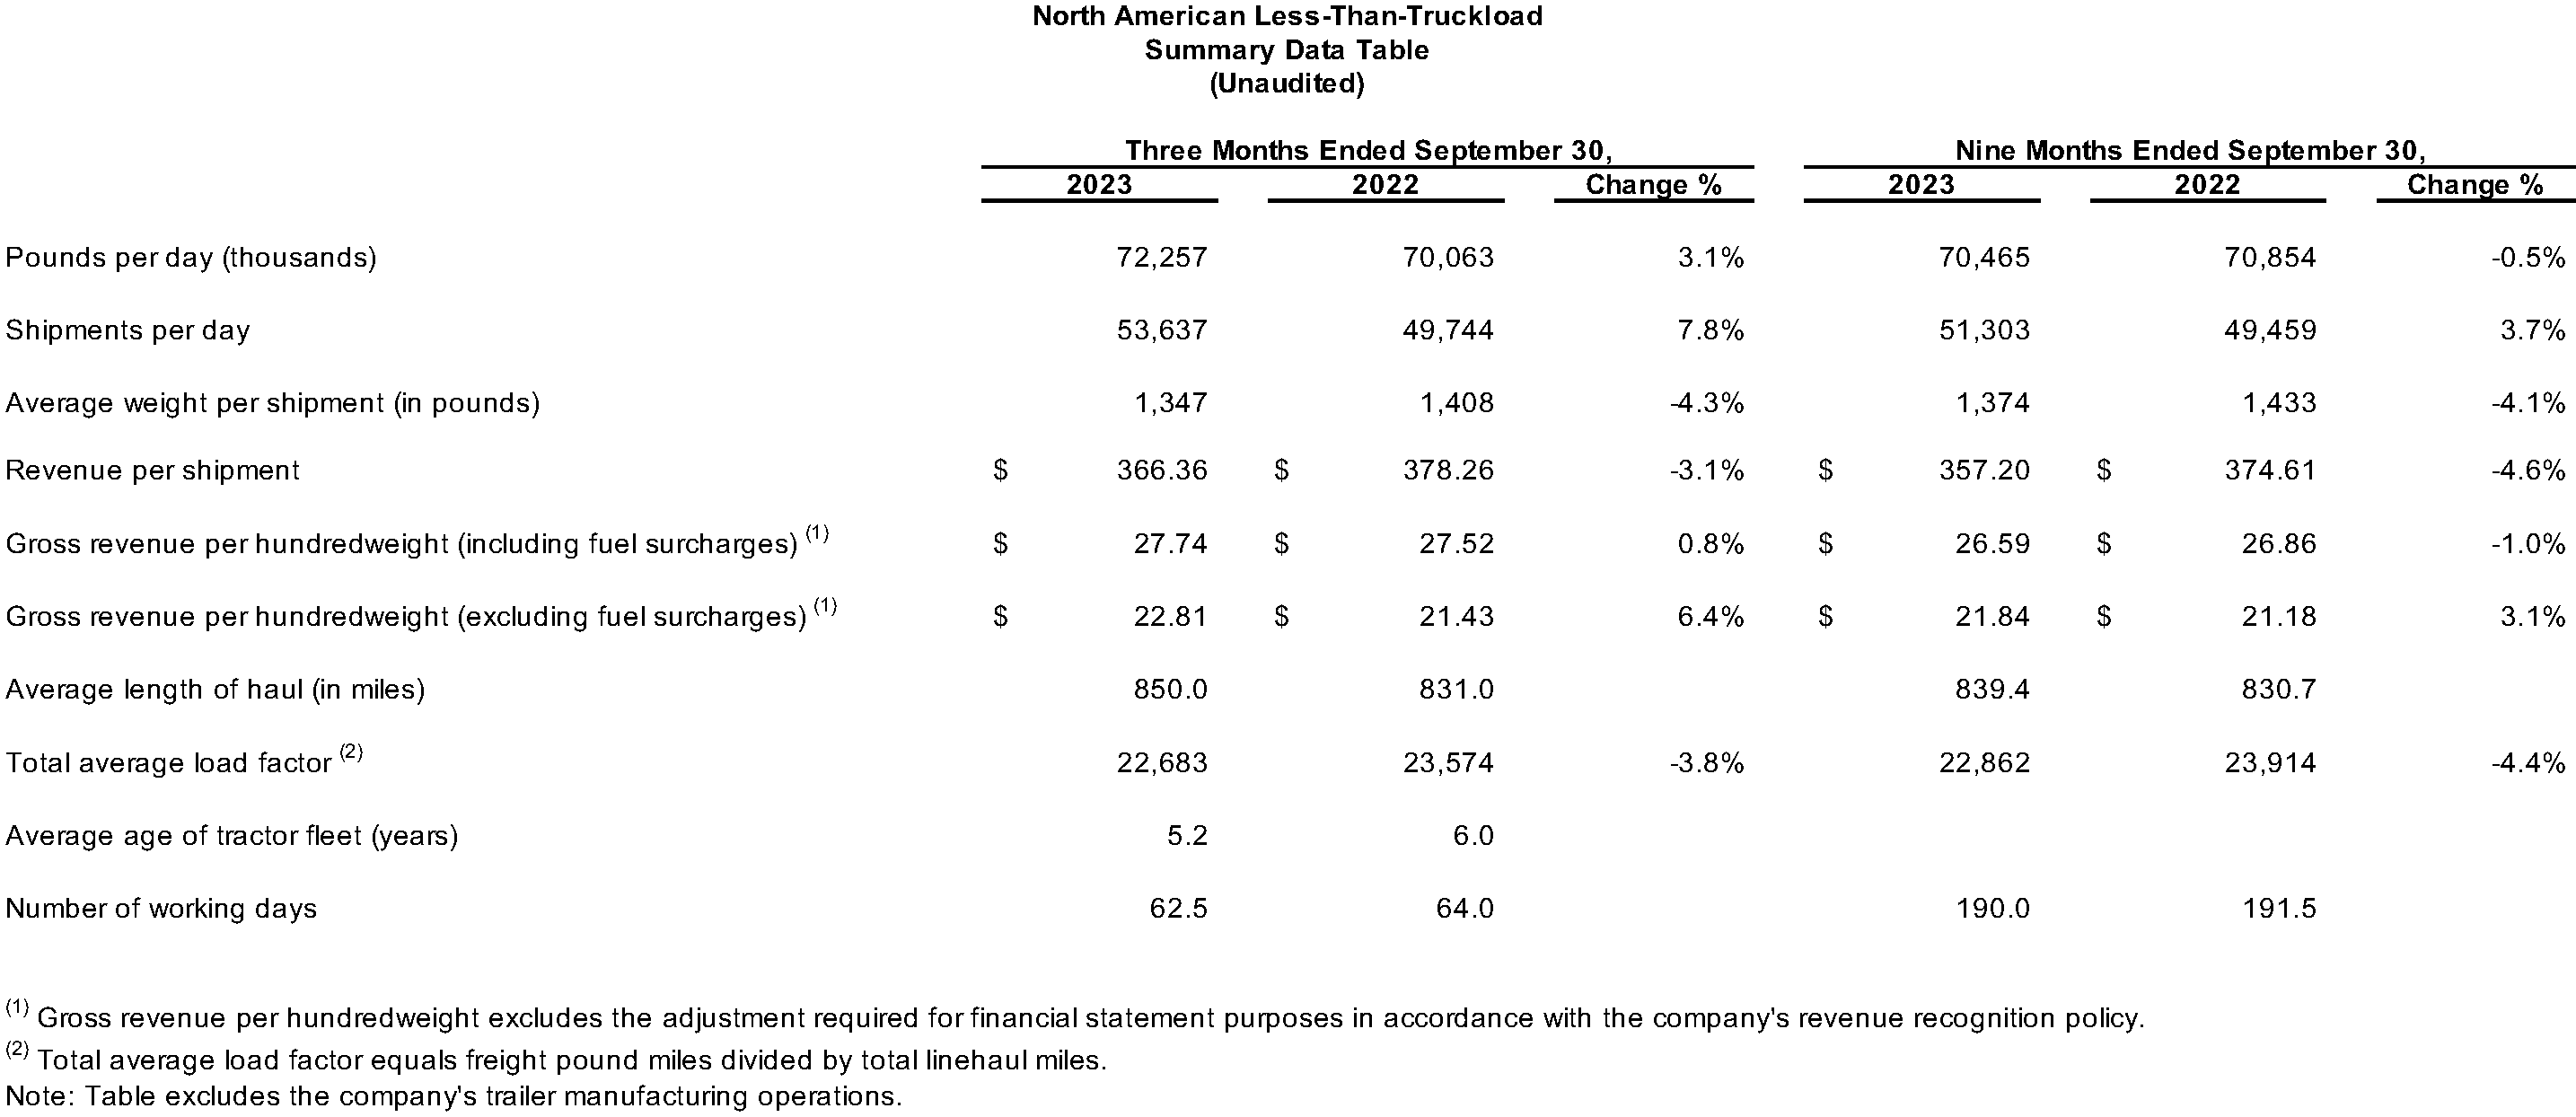
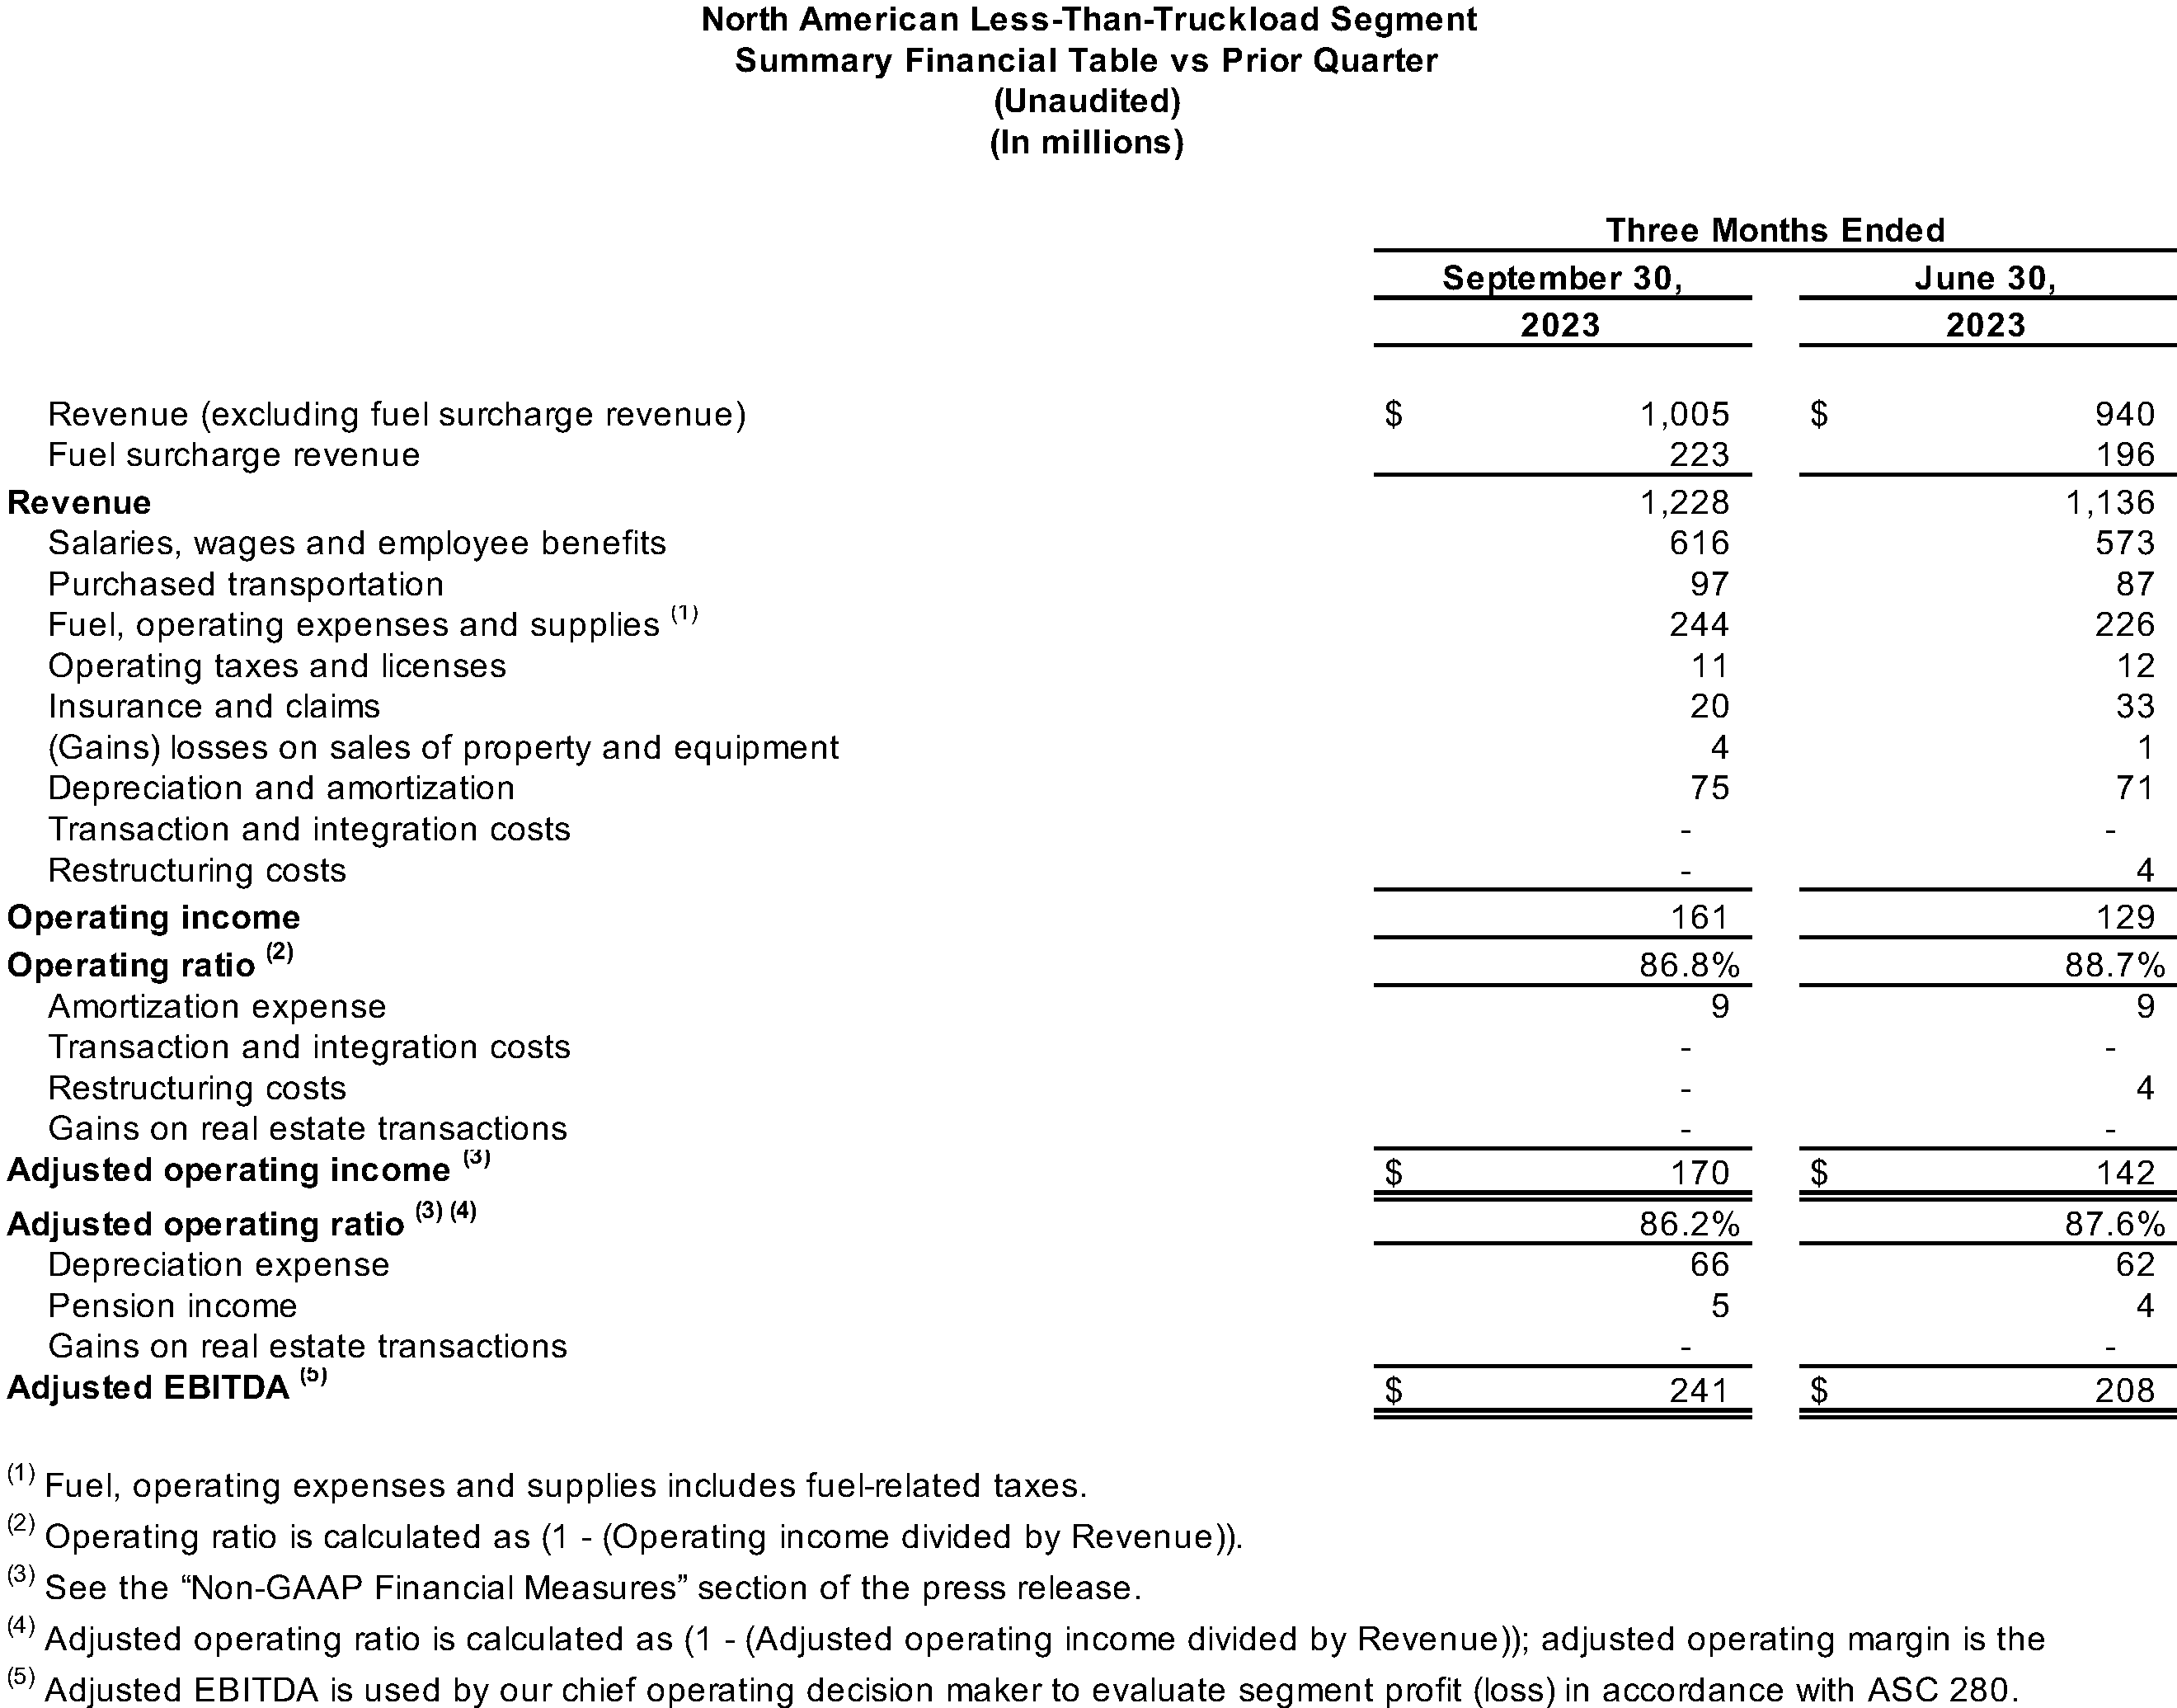
- North American Less-Than-Truckload (LTL): The segment generated revenue of $1.23 billion for the third quarter 2023, compared with $1.21 billion for the same period in 2022. On a year-over-year basis, shipments per day increased 7.8%, tonnage per day increased 3.1%, and yield, excluding fuel, increased 6.4%. Including fuel, yield increased 0.8%.
Operating income was $161 million for the third quarter 2023, compared with $162 million for the same period in 2022. Adjusted operating ratio, a non-GAAP financial measure, was 86.2%, compared with 85.6% a year ago, reflecting a sequential improvement of 140 basis points, compared with the second quarter in 2023.
Adjusted EBITDA for the third quarter 2023 was $241 million, compared with $240 million for the same period in 2022. The year-over-year increase in adjusted EBITDA was due primarily to higher tonnage per day and yield, excluding fuel, partially offset by lower fuel surcharge revenue and pension income.
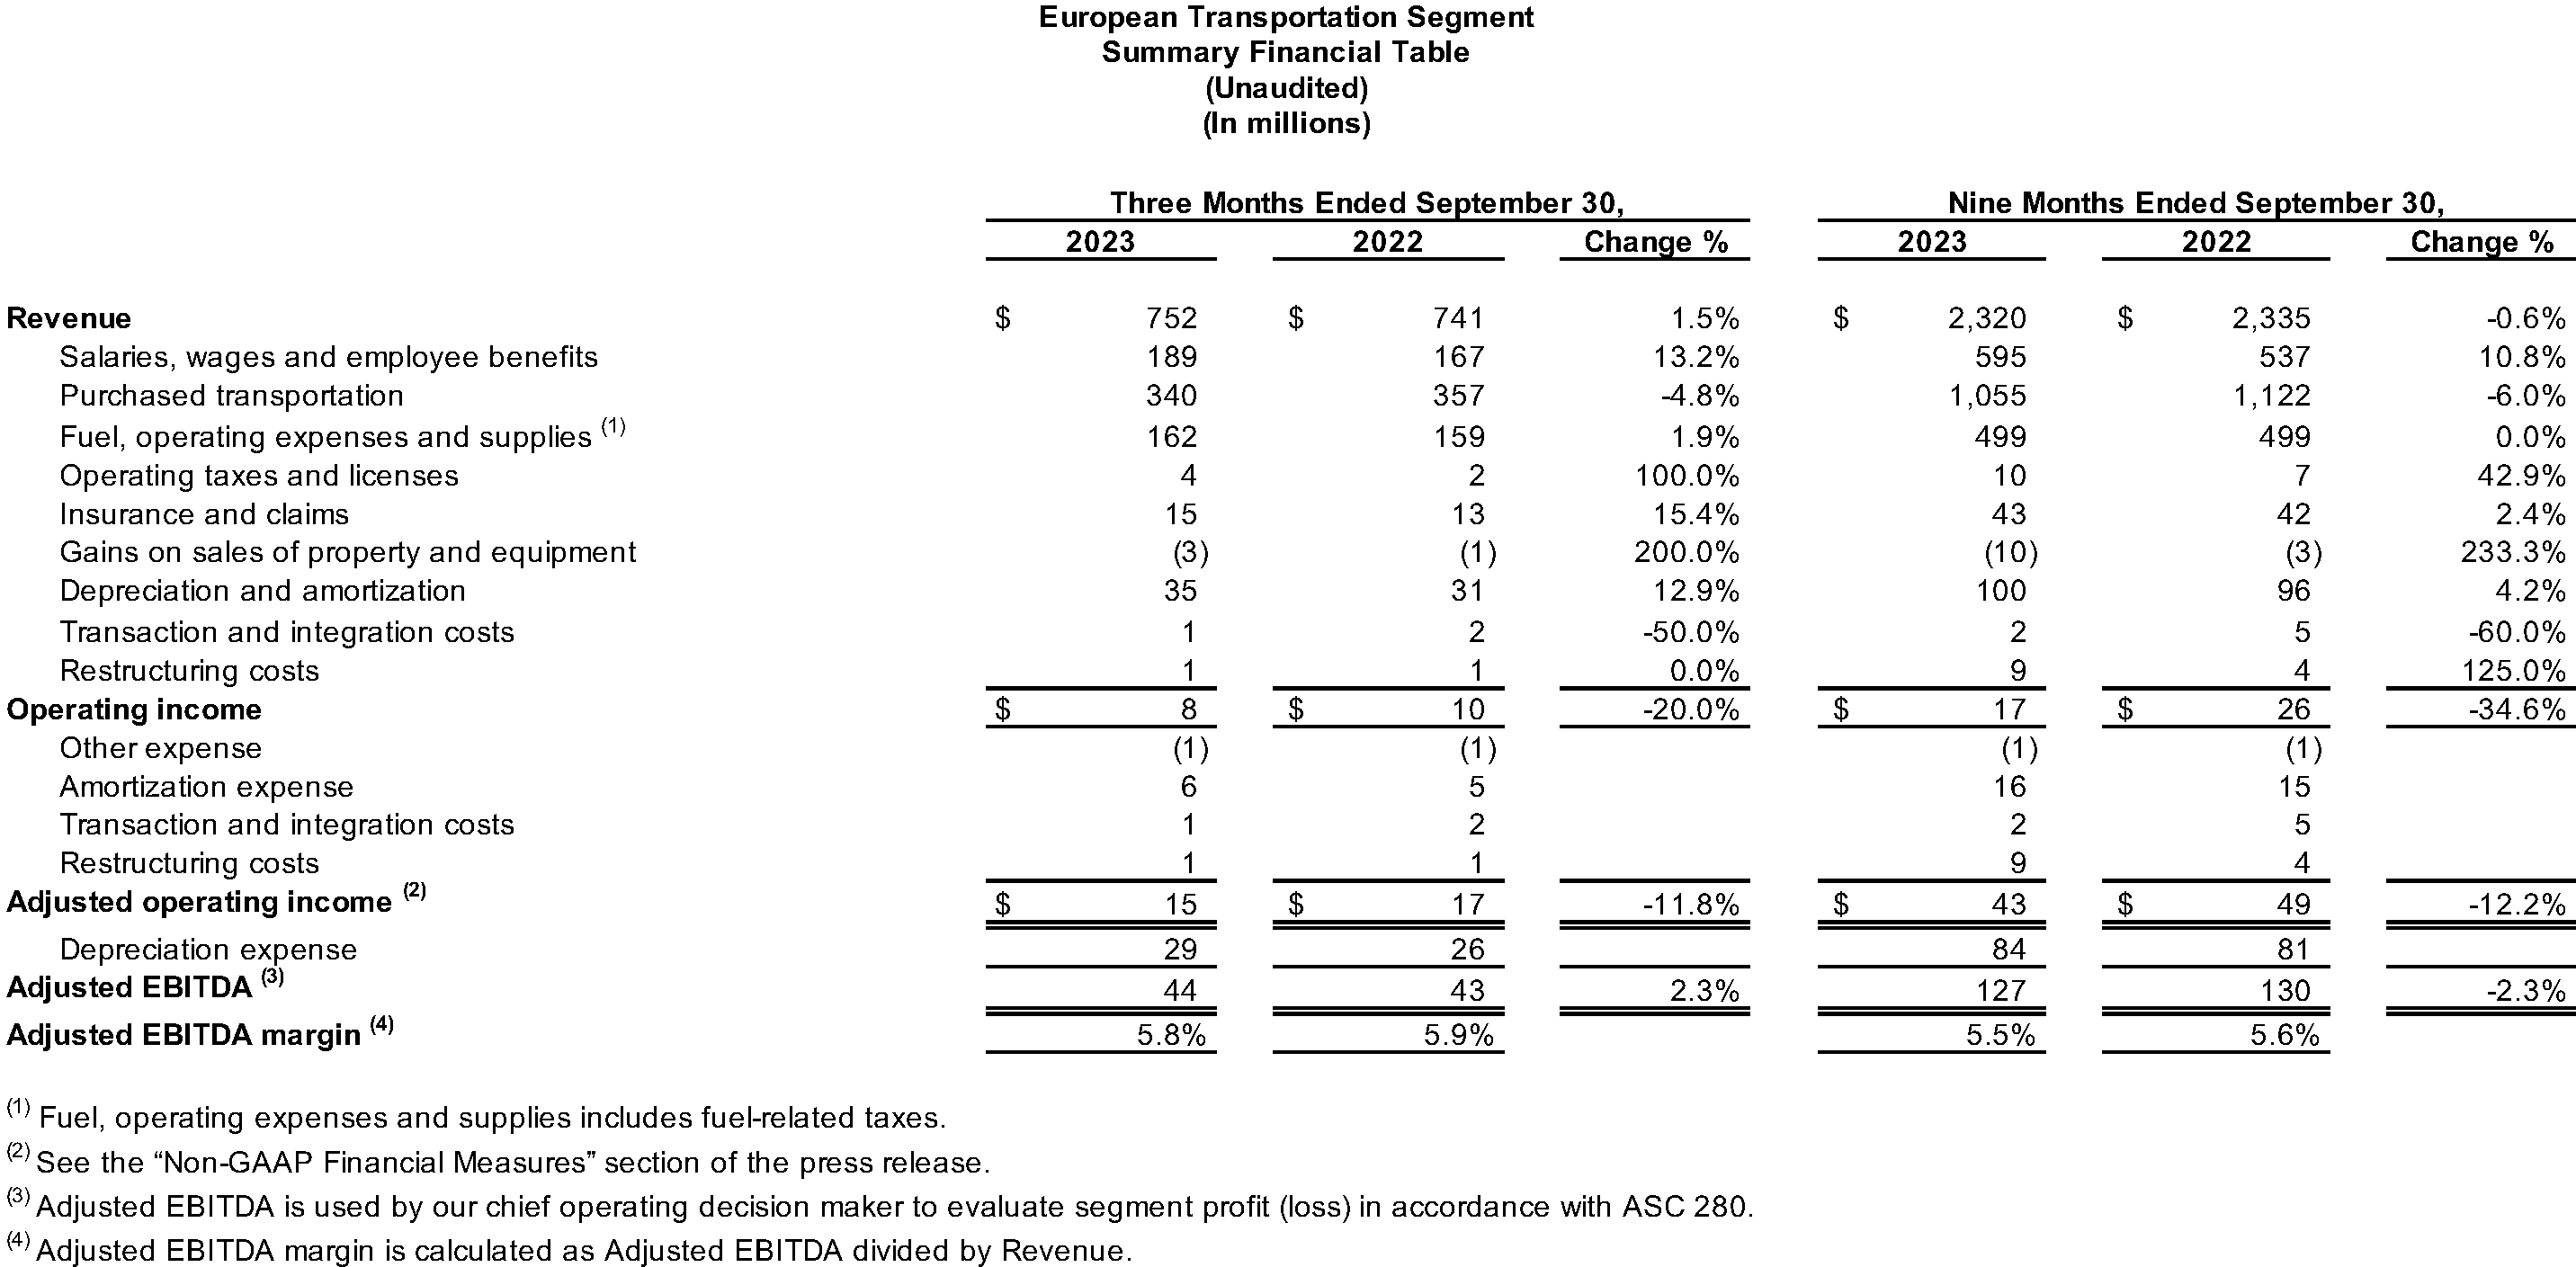
- European Transportation: The segment generated revenue of $752 million for the third quarter 2023, compared with $741 million for the same period in 2022.
Operating income was $8 million for the third quarter 2023, compared with $10 million for the same period in 2022. Adjusted EBITDA was $44 million for the third quarter 2023, compared with $43 million for the same period in 2022.
Conference Call
The company will hold a conference call on Monday, October 30, 2023, at 8:30 a.m. Eastern Time. Participants can call toll-free (from US/Canada) 1-877-269-7756; international callers dial +1-201-689-7817. A live webcast of the conference will be available on the investor relations area of the company’s website, xpo.com/investors. The conference will be archived until November 29, 2023. To access the replay by phone, call toll-free (from US/Canada) 1-877-660-6853; international callers dial +1-201-612-7415. Use participant passcode 13741540.
About XPO
XPO, Inc. (NYSE: XPO) is one of the largest providers of asset-based less-than-truckload (LTL) transportation in North America, with proprietary technology that moves goods efficiently through its network. Together with its business in Europe, XPO serves approximately 50,000 customers with 563 locations and 38,000 employees. The company is headquartered in Greenwich, Conn., USA. Visit xpo.com for more information, and connect with XPO on Facebook, X, LinkedIn, Instagram and YouTube.
Non-GAAP Financial Measures
As required by the rules of the Securities and Exchange Commission (“SEC”), we provide reconciliations of the non-GAAP financial measures contained in this press release to the most directly comparable measure under GAAP, which are set forth in the financial tables attached to this press release.
XPO’s non-GAAP financial measures in this press release include: adjusted earnings before interest, taxes, depreciation and amortization (“adjusted EBITDA”) on a consolidated basis and for corporate; adjusted EBITDA margin on a consolidated basis; adjusted net income from continuing operations attributable to common shareholders; adjusted diluted earnings from continuing operations per share (“adjusted diluted EPS”); adjusted operating income for our North American Less-Than-Truckload and European Transportation segments; and adjusted operating ratio for our North American Less-Than-Truckload segment.
We believe that the above adjusted financial measures facilitate analysis of our ongoing business operations because they exclude items that may not be reflective of, or are unrelated to, XPO and its business segments’ core operating performance, and may assist investors with comparisons to prior periods and assessing trends in our underlying businesses. Other companies may calculate these non-GAAP financial measures differently, and therefore our measures may not be comparable to similarly titled measures of other companies. These non-GAAP financial measures should only be used as supplemental measures of our operating performance.
Adjusted EBITDA, adjusted EBITDA margin, adjusted net income from continuing operations attributable to common shareholders and adjusted diluted EPS include adjustments for transaction and integration costs, as well as restructuring costs and other adjustments as set forth in the attached tables. Transaction and integration adjustments are generally incremental costs that result from an actual or planned acquisition, divestiture or spin-off and may include transaction costs, consulting fees, stock-based compensation, retention awards, internal salaries and wages (to the extent the individuals are assigned full-time to integration and transformation activities) and certain costs related to integrating and converging IT systems. Restructuring costs primarily relate to severance costs associated with business optimization initiatives. Management uses these non-GAAP financial measures in making financial, operating and planning decisions and evaluating XPO’s and each business segment’s ongoing performance.
We believe that adjusted EBITDA and adjusted EBITDA margin improve comparability from period to period by removing the impact of our capital structure (interest and financing expenses), asset base (depreciation and amortization), tax impacts and other adjustments as set out in the attached tables that management has determined are not reflective of core operating activities and thereby assist investors with assessing trends in our underlying businesses. We believe that adjusted net income from continuing operations attributable to common shareholders and adjusted diluted EPS improve the comparability of our operating results from period to period by removing the impact of certain costs and gains that management has determined are not reflective of our core operating activities, including amortization of acquisition-related intangible assets, transaction and integration costs, restructuring costs and other adjustments as set out in the attached tables. We believe that adjusted operating income and adjusted operating ratio improve the comparability of our operating results from period to period by removing the impact of certain transaction and integration costs and restructuring costs, as well as amortization expenses as set out in the attached tables.
Forward-looking Statements
This release includes forward-looking statements within the meaning of Section 27A of the Securities Act of 1933, as amended, and Section 21E of the Securities Exchange Act of 1934, as amended. All statements other than statements of historical fact are, or may be deemed to be, forward-looking statements. In some cases, forward-looking statements can be identified by the use of forward-looking terms such as “anticipate,” “estimate,” “believe,” “continue,” “could,” “intend,” “may,” “plan,” “potential,” “predict,” “should,” “will,” “expect,” “objective,” “projection,” “forecast,” “goal,” “guidance,” “outlook,” “effort,” “target,” “trajectory” or the negative of these terms or other comparable terms. These forward-looking statements are based on certain assumptions and analyses made by us in light of our experience and our perception of historical trends, current conditions and expected future developments, as well as other factors we believe are appropriate in the circumstances.
These forward-looking statements are subject to known and unknown risks, uncertainties and assumptions that may cause actual results, levels of activity, performance or achievements to be materially different from any future results, levels of activity, performance or achievements expressed or implied by such forward-looking statements. Factors that might cause or contribute to a material difference include the risks discussed in our filings with the SEC, and the following: the effects of business, economic, political, legal, and regulatory impacts or conflicts upon our operations; supply chain disruptions, the global shortage of certain components such as semiconductor chips, strains on production or extraction of raw materials, cost inflation and labor and equipment shortages; our ability to align our investments in capital assets, including equipment, service centers, and warehouses and other network facilities, to our customers’ demands; our ability to implement our cost and revenue initiatives; the effectiveness of our action plan, and other management actions, to improve our North American LTL business; our ability to benefit from a sale, spin-off or other divestiture of one or more business units; our ability to successfully integrate and realize anticipated synergies, cost savings and profit improvement opportunities with respect to acquired companies; goodwill impairment, including in connection with a business unit sale or other divestiture; fluctuations in currency exchange rates; fuel price and fuel surcharge changes; the expected benefits of the spin-offs of GXO Logistics, Inc. and RXO, Inc. on the size and business diversity of our company; our ability to develop and implement suitable information technology systems and prevent failures in or breaches of such systems; our indebtedness; our ability to raise debt and equity capital; fluctuations in fixed and floating interest rates; our ability to maintain positive relationships with our network of third-party transportation providers; our ability to attract and retain qualified drivers; labor matters; litigation; risks associated with our self-insured claims; governmental or political actions; and competition and pricing pressures.
All forward-looking statements set forth in this release are qualified by these cautionary statements and there can be no assurance that the actual results or developments anticipated by us will be realized or, even if substantially realized, that they will have the expected consequences to or effects on us or our business or operations. Forward-looking statements set forth in this release speak only as of the date hereof, and we do not undertake any obligation to update forward-looking statements except to the extent required by law.