Reports highest revenue of any quarter in company history
Generates record first quarter net income and adjusted EBITDA
Reaffirms expected year-over-year improvement in 2022 adjusted operating ratio of more than 100 basis points in North American LTL
Delivers sixth consecutive quarter of year-over-year load growth over 20% in North American truck brokerage
Reduces net debt leverage to 2.0x from 2.7x in prior quarter
Raises full year 2022 outlook to reflect higher expectations for adjusted EBITDA
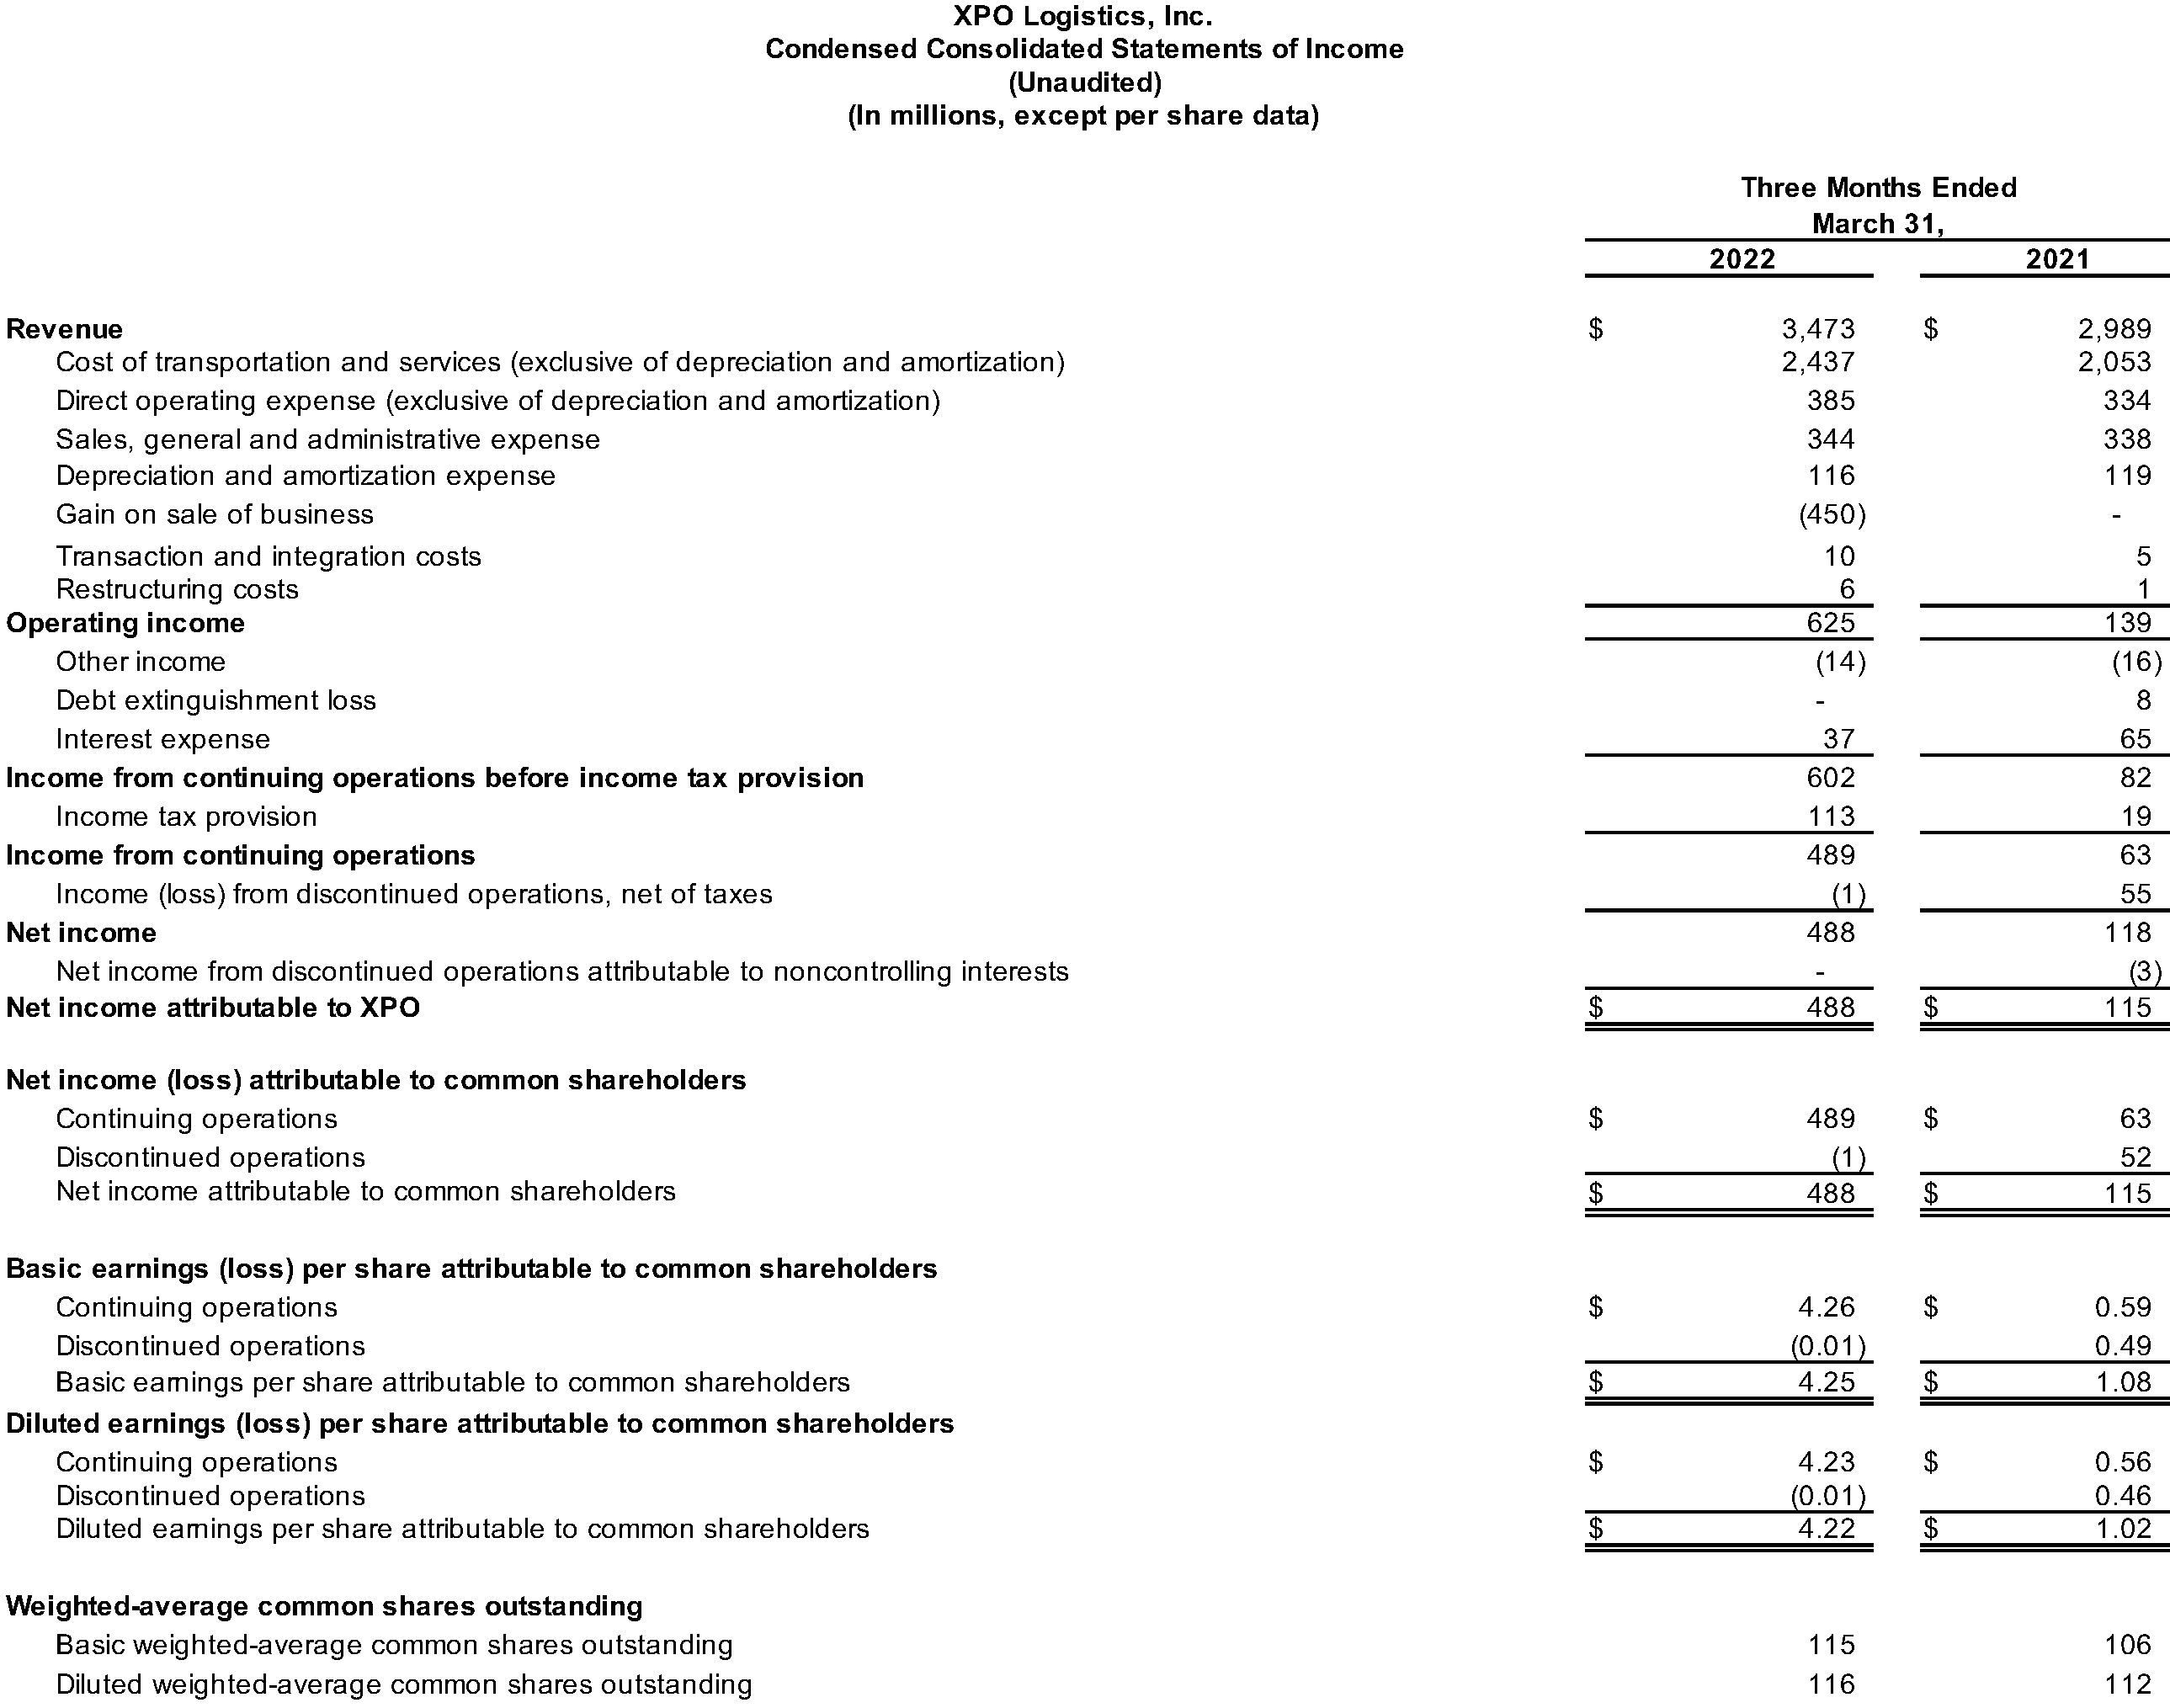
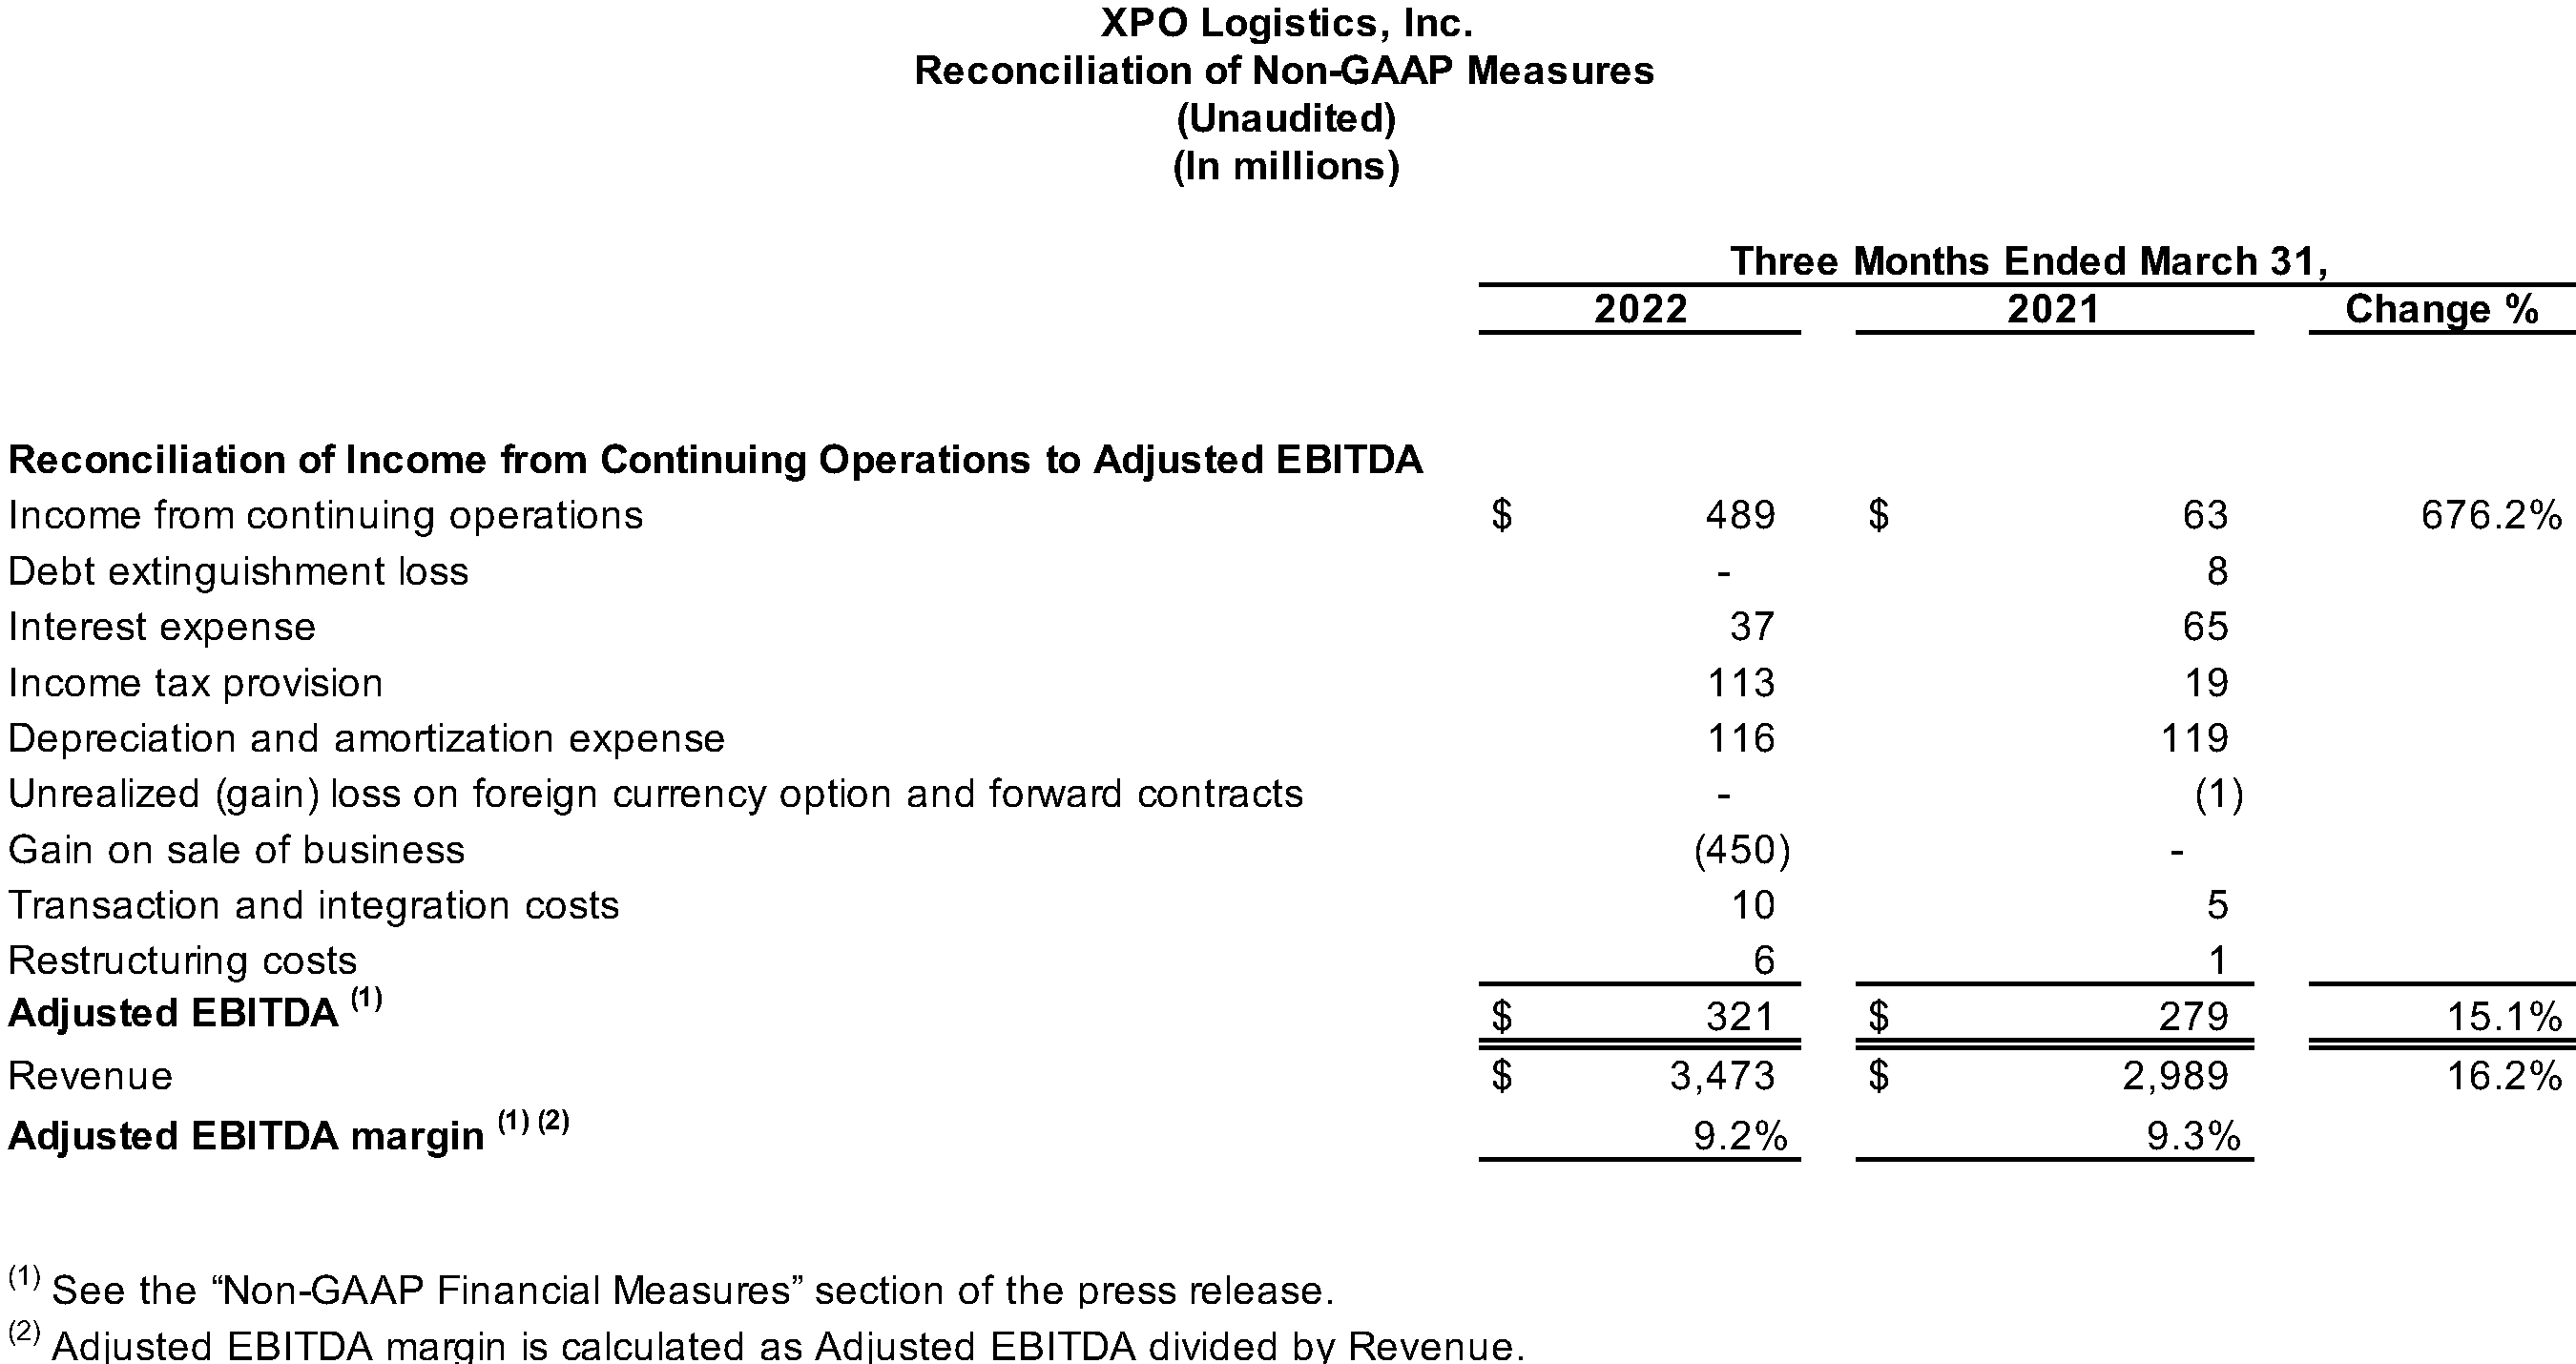
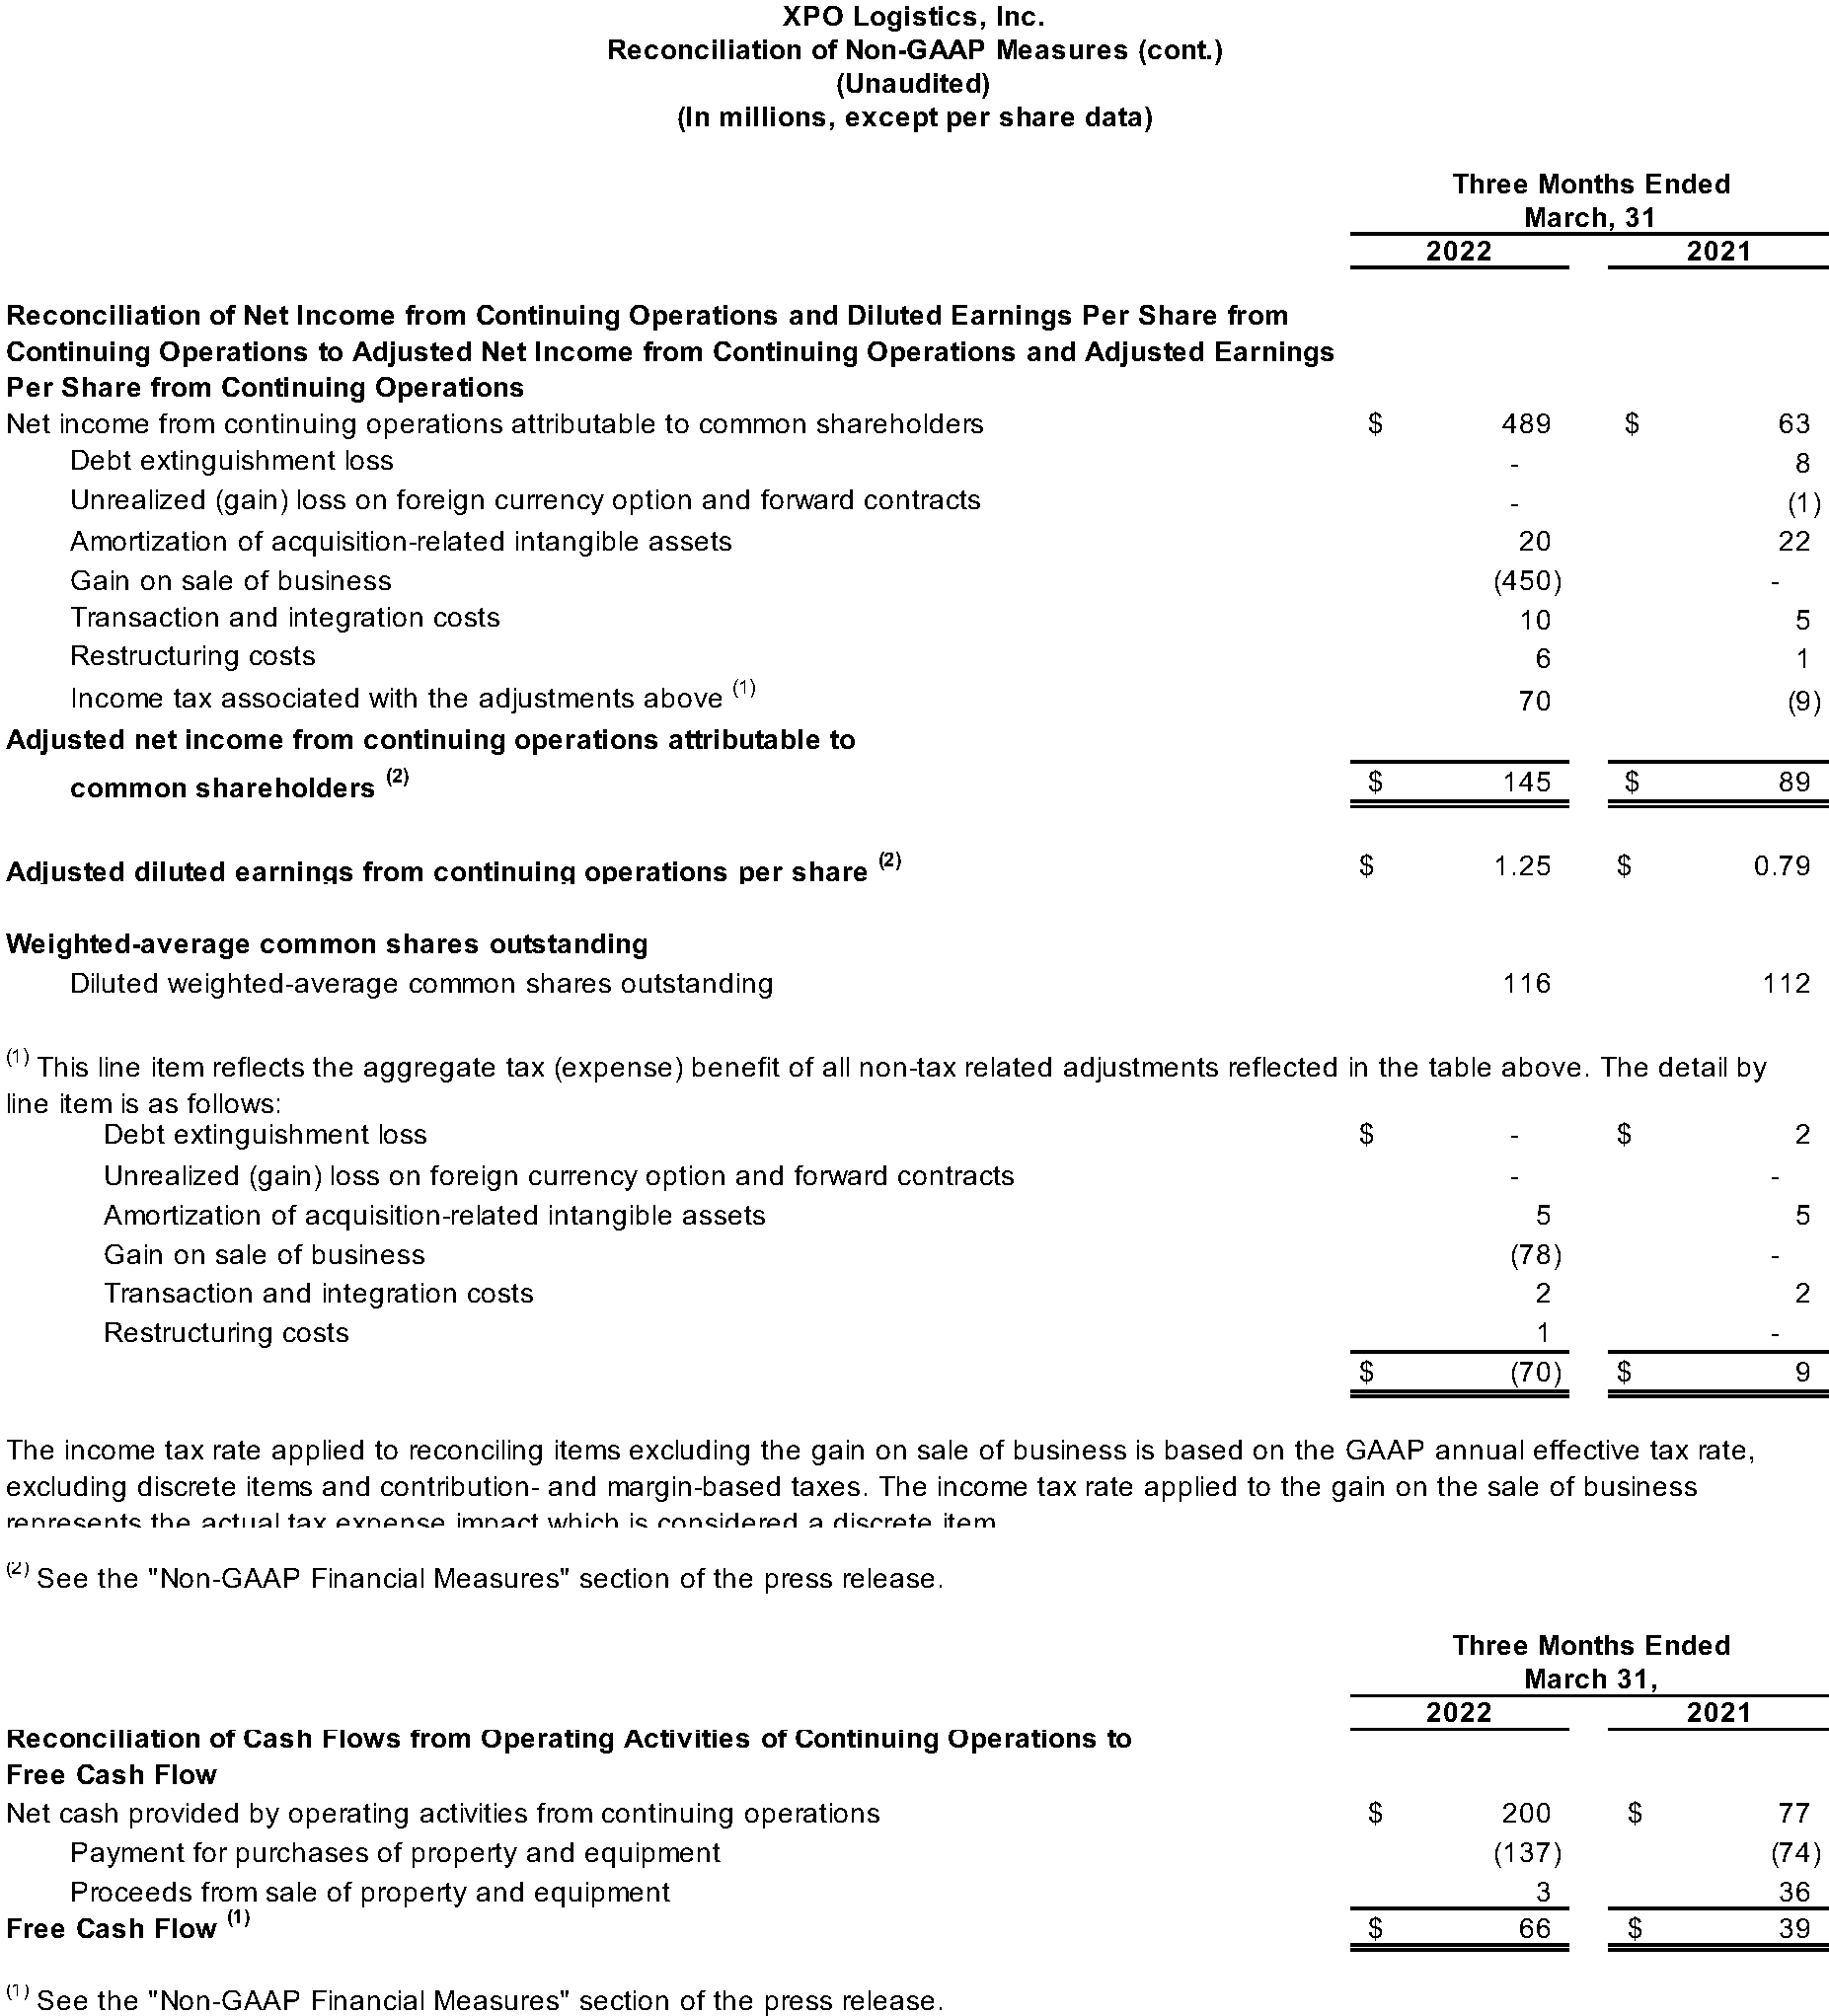
XPO Logistics, Inc. (NYSE: XPO) today announced its financial results for the first quarter 2022. Revenue increased to $3.47 billion for the first quarter, compared with $2.99 billion for the same period in 2021. Net income from continuing operations attributable to common shareholders was $489 million for the first quarter, compared with $63 million for the same period in 2021. Operating income was $625 million for the first quarter, compared with $139 million for the same period in 2021. Income from continuing operations was $489 million, compared with $63 million for the same period in 2021. Diluted earnings from continuing operations per share was $4.23 for the first quarter, compared with $0.56 for the same period in 2021.
Adjusted net income attributable to common shareholders, a non-GAAP financial measure, increased to $145 million for the first quarter, compared with $89 million for the same period in 2021. Adjusted diluted earnings from continuing operations per share, a non-GAAP financial measure, was $1.25 for the first quarter, compared with $0.79 for the same period in 2021.
Adjusted earnings before interest, taxes, depreciation and amortization (“adjusted EBITDA”), a non-GAAP financial measure, increased to $321 million for the first quarter, compared with $279 million for the same period in 2021.
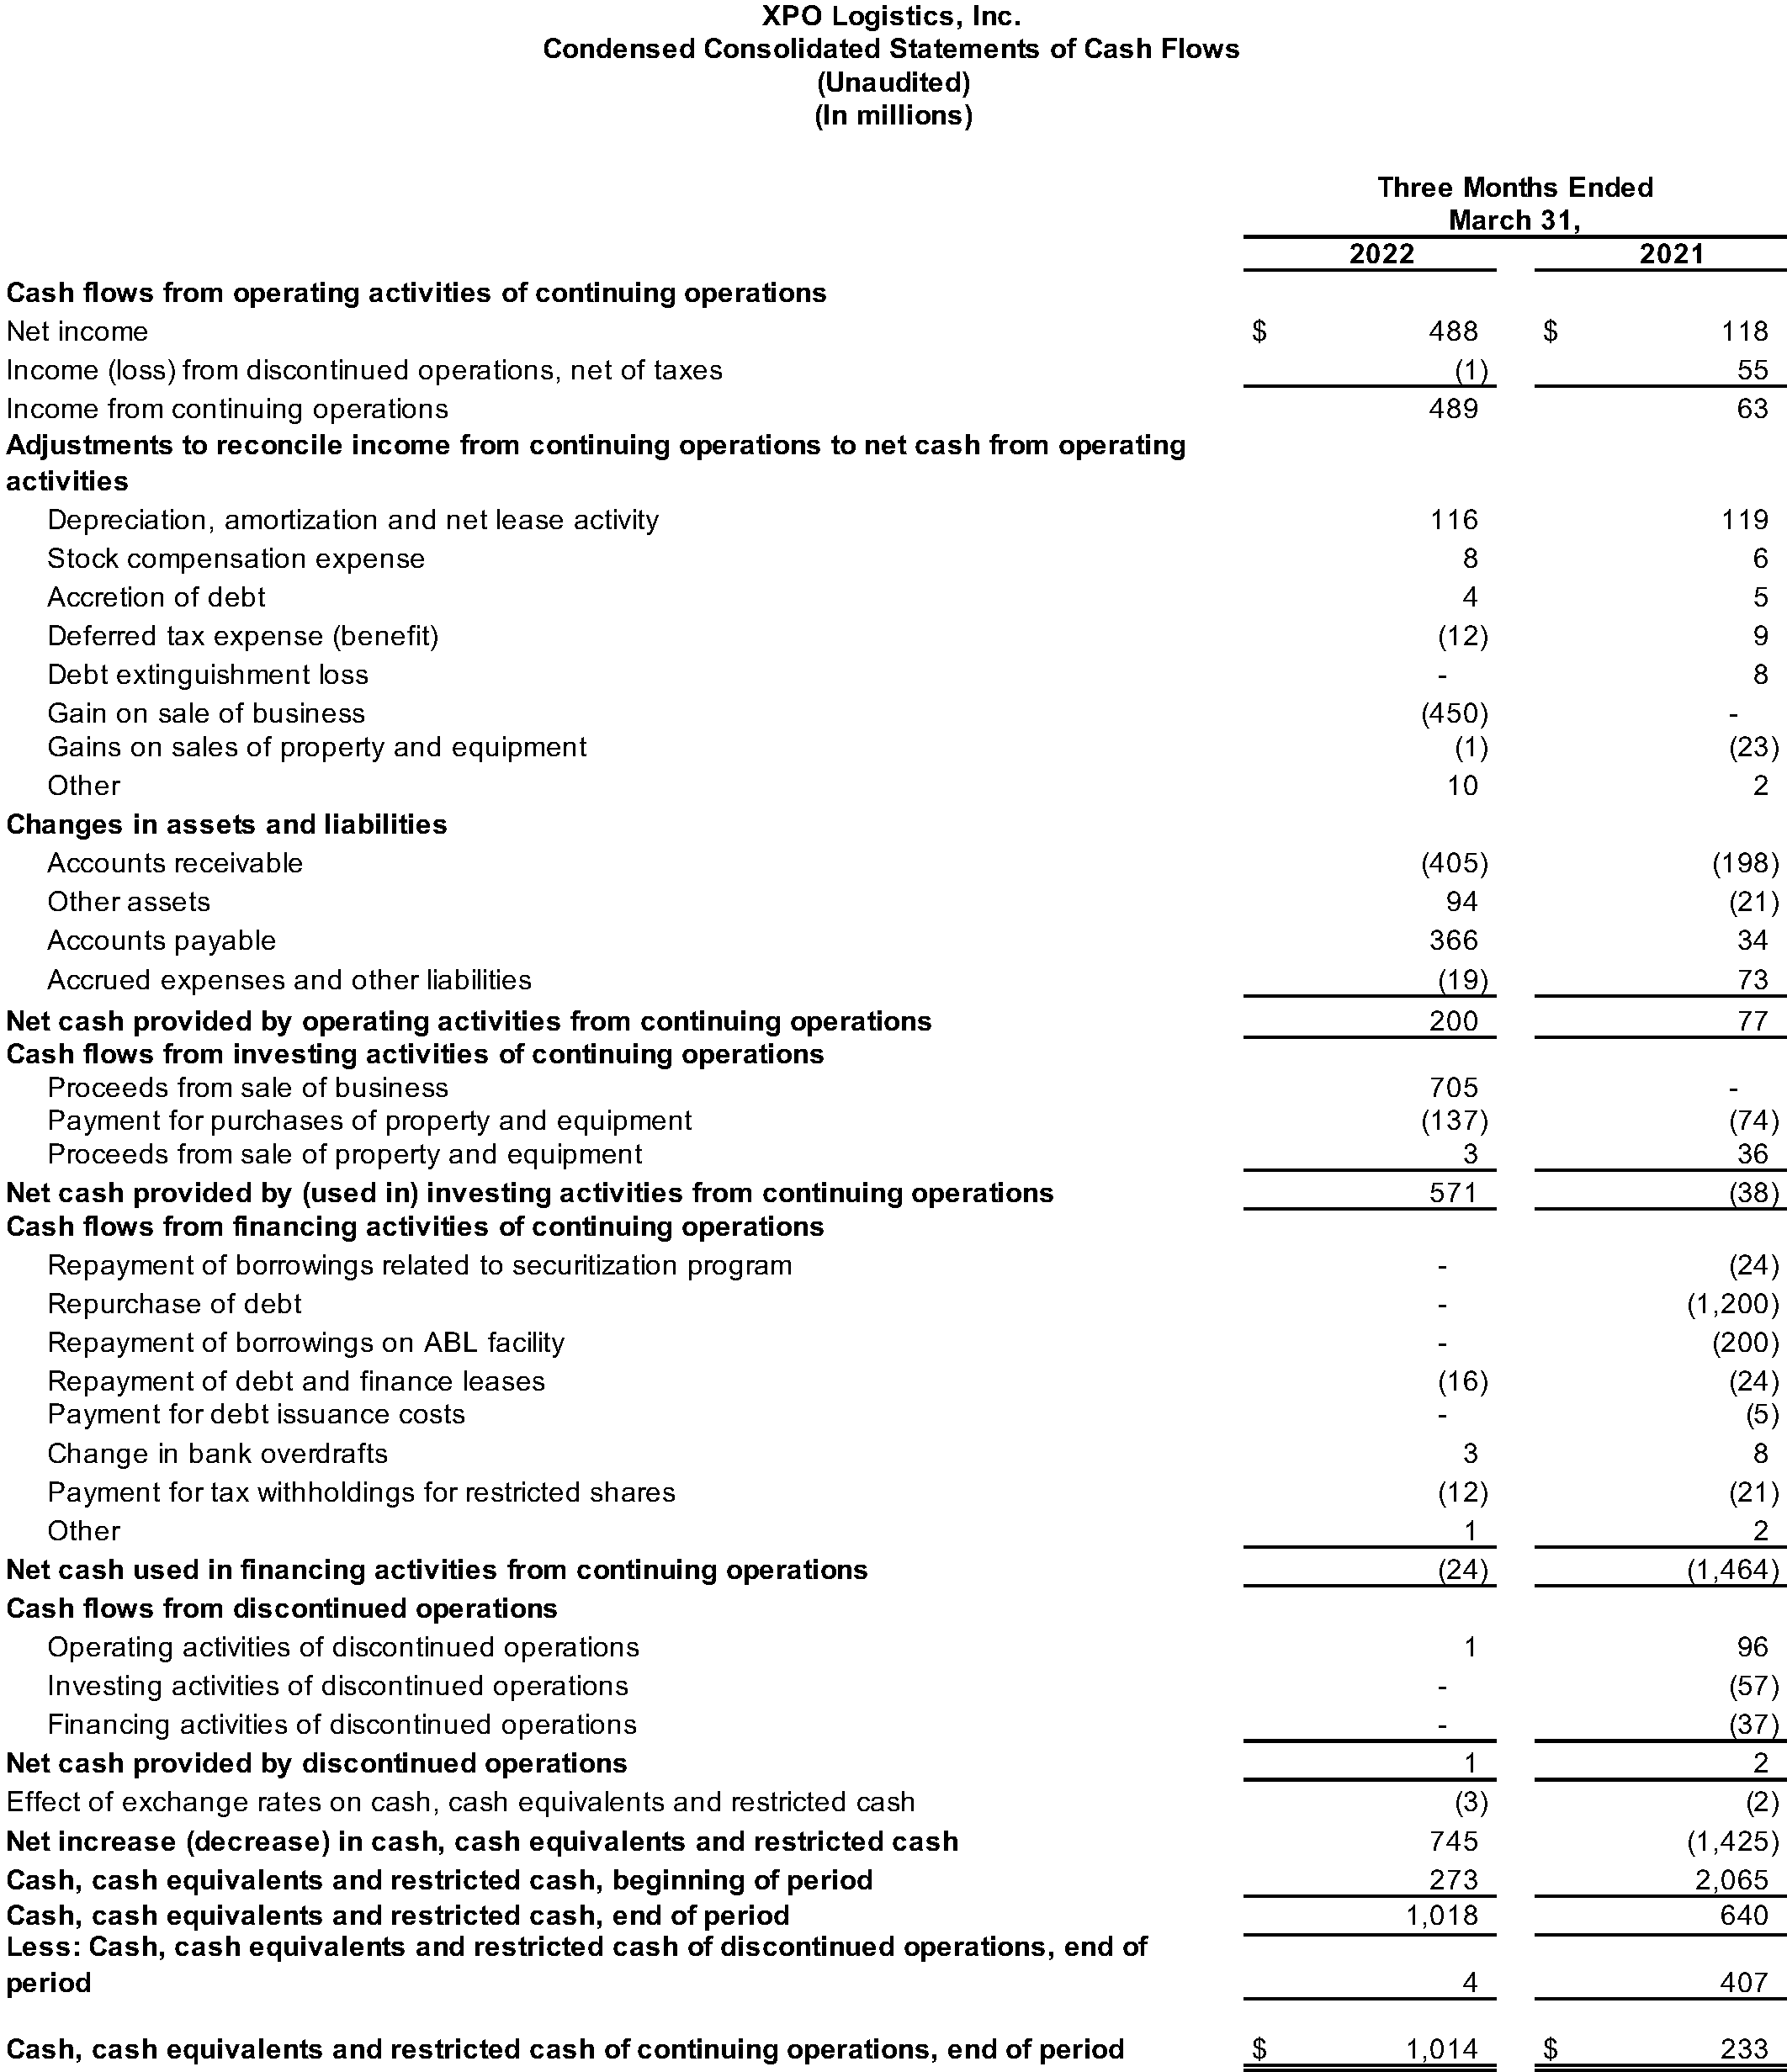
For the first quarter 2022, the company generated $200 million of cash flow from operating activities and $66 million of free cash flow, a non-GAAP financial measure.
Reconciliations of non-GAAP financial measures used in this release are provided in the attached financial tables.
Raises 2022 Outlook
After adjusting for the sale of the intermodal operation, the company raised its 2022 target for adjusted EBITDA, and updated the underlying metrics, to reflect its higher expectations for 2022 financial performance:
- Adjusted EBITDA of $1.35 billion to $1.39 billion, including second quarter adjusted EBITDA of $360 million to $370 million;
- North American LTL expected to generate at least $1 billion of full year adjusted EBITDA;
- Year-over-year improvement of more than 100 basis points in North American LTL adjusted operating ratio, excluding gains on sales of real estate;
- Depreciation and amortization of approximately $385 million, excluding amortization of acquisition-related intangible assets;
- Interest expense of $150 million to $160 million;
- Effective tax rate of 24% to 25%; and
- Adjusted diluted EPS of $5.20 to $5.60, excluding amortization of acquisition-related intangible assets, and assuming 117 million diluted shares outstanding at year-end 2022.
With respect to 2022 cash flows:
- Gross capital expenditures of $500 million to $550 million;
- Net capital expenditures of $425 million to $475 million; and
- Free cash flow of $400 million to $450 million, excluding all transaction-related impacts.
CEO Comments
Brad Jacobs, chairman and chief executive officer of XPO Logistics, said, “We delivered a record first quarter, with significant beats across revenue, net income, adjusted EBITDA and adjusted EPS. We’re executing on multiple avenues for value creation — the spin-off of our tech-enabled brokered services platform, the sale or listing of our European business, our continued deleveraging, and company-specific initiatives for the ongoing transformation of our North American LTL business.
“Over the last six months, we’ve been investing in making our LTL network larger and more efficient, with more to follow. Service levels have markedly improved, and our yield was a record first quarter increase of 9% from a year ago. We continue to expect our adjusted operating ratio to inflect to year-over-year improvement later this quarter, with an improvement of more than 100 basis points for the full year. We plan to drive hundreds of additional basis points of improvement in the coming years.
“Our best-in-class truck brokerage business gained share again in the quarter, with year-over-year load growth of 23%. Shippers increasingly want cutting-edge brokerage automation, and our XPO Connect platform gives them access to more than one and a half million carrier trucks. We’re creating or covering 74% of our brokerage loads digitally on the platform, up four percentage points from the fourth quarter.”
Jacobs continued, “Following our eighth straight beat on adjusted EBITDA in the quarter, our April results accelerated both sequentially and year-over year in many of our key metrics. We raised our full-year financial outlook by more than the beat to reflect our momentum.”
Results by Business Segment
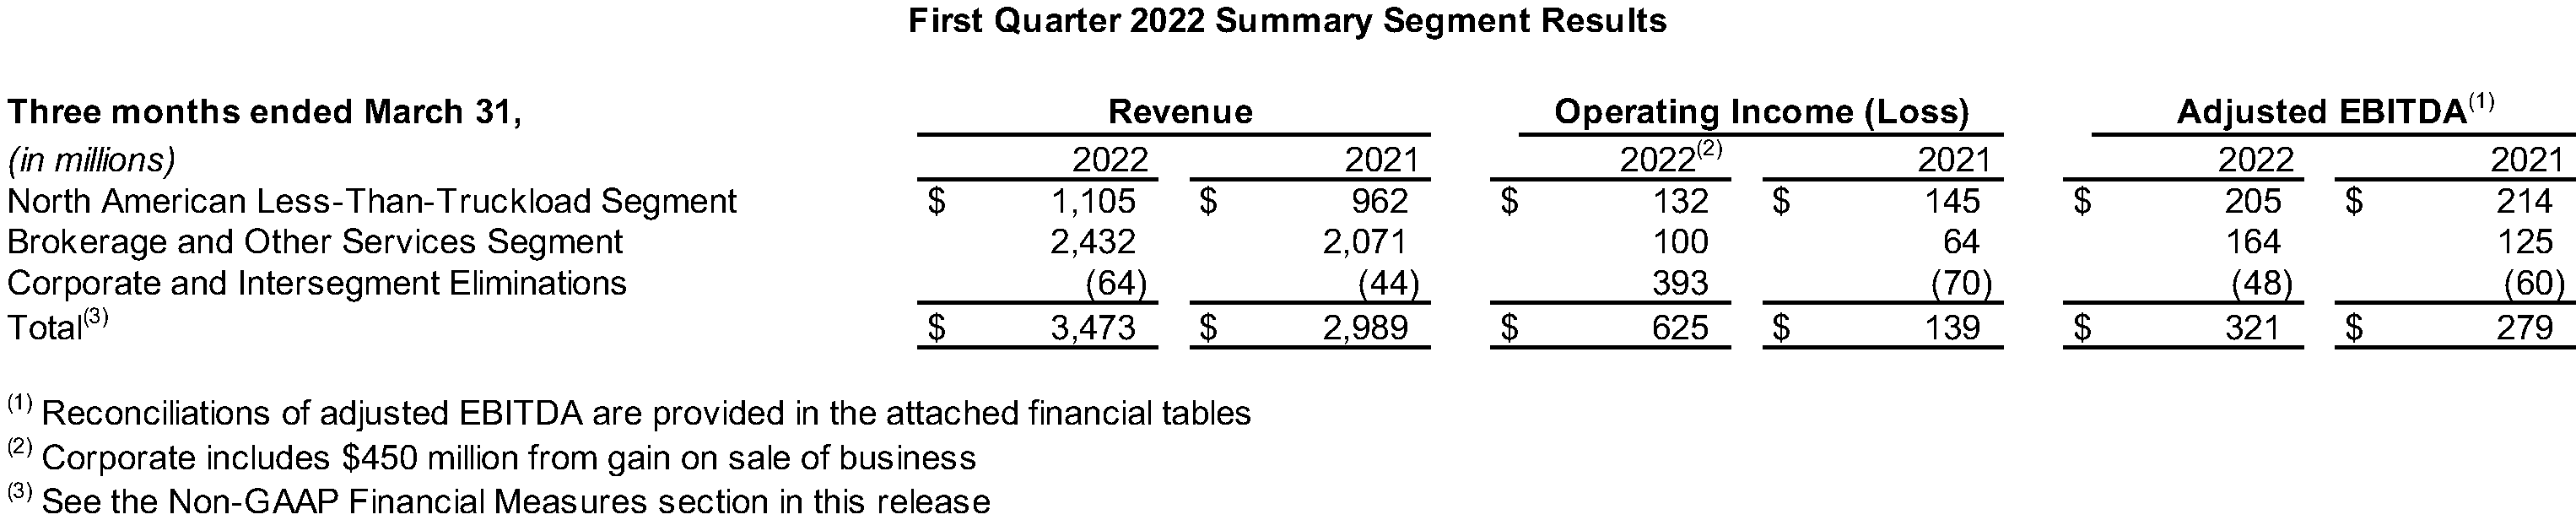
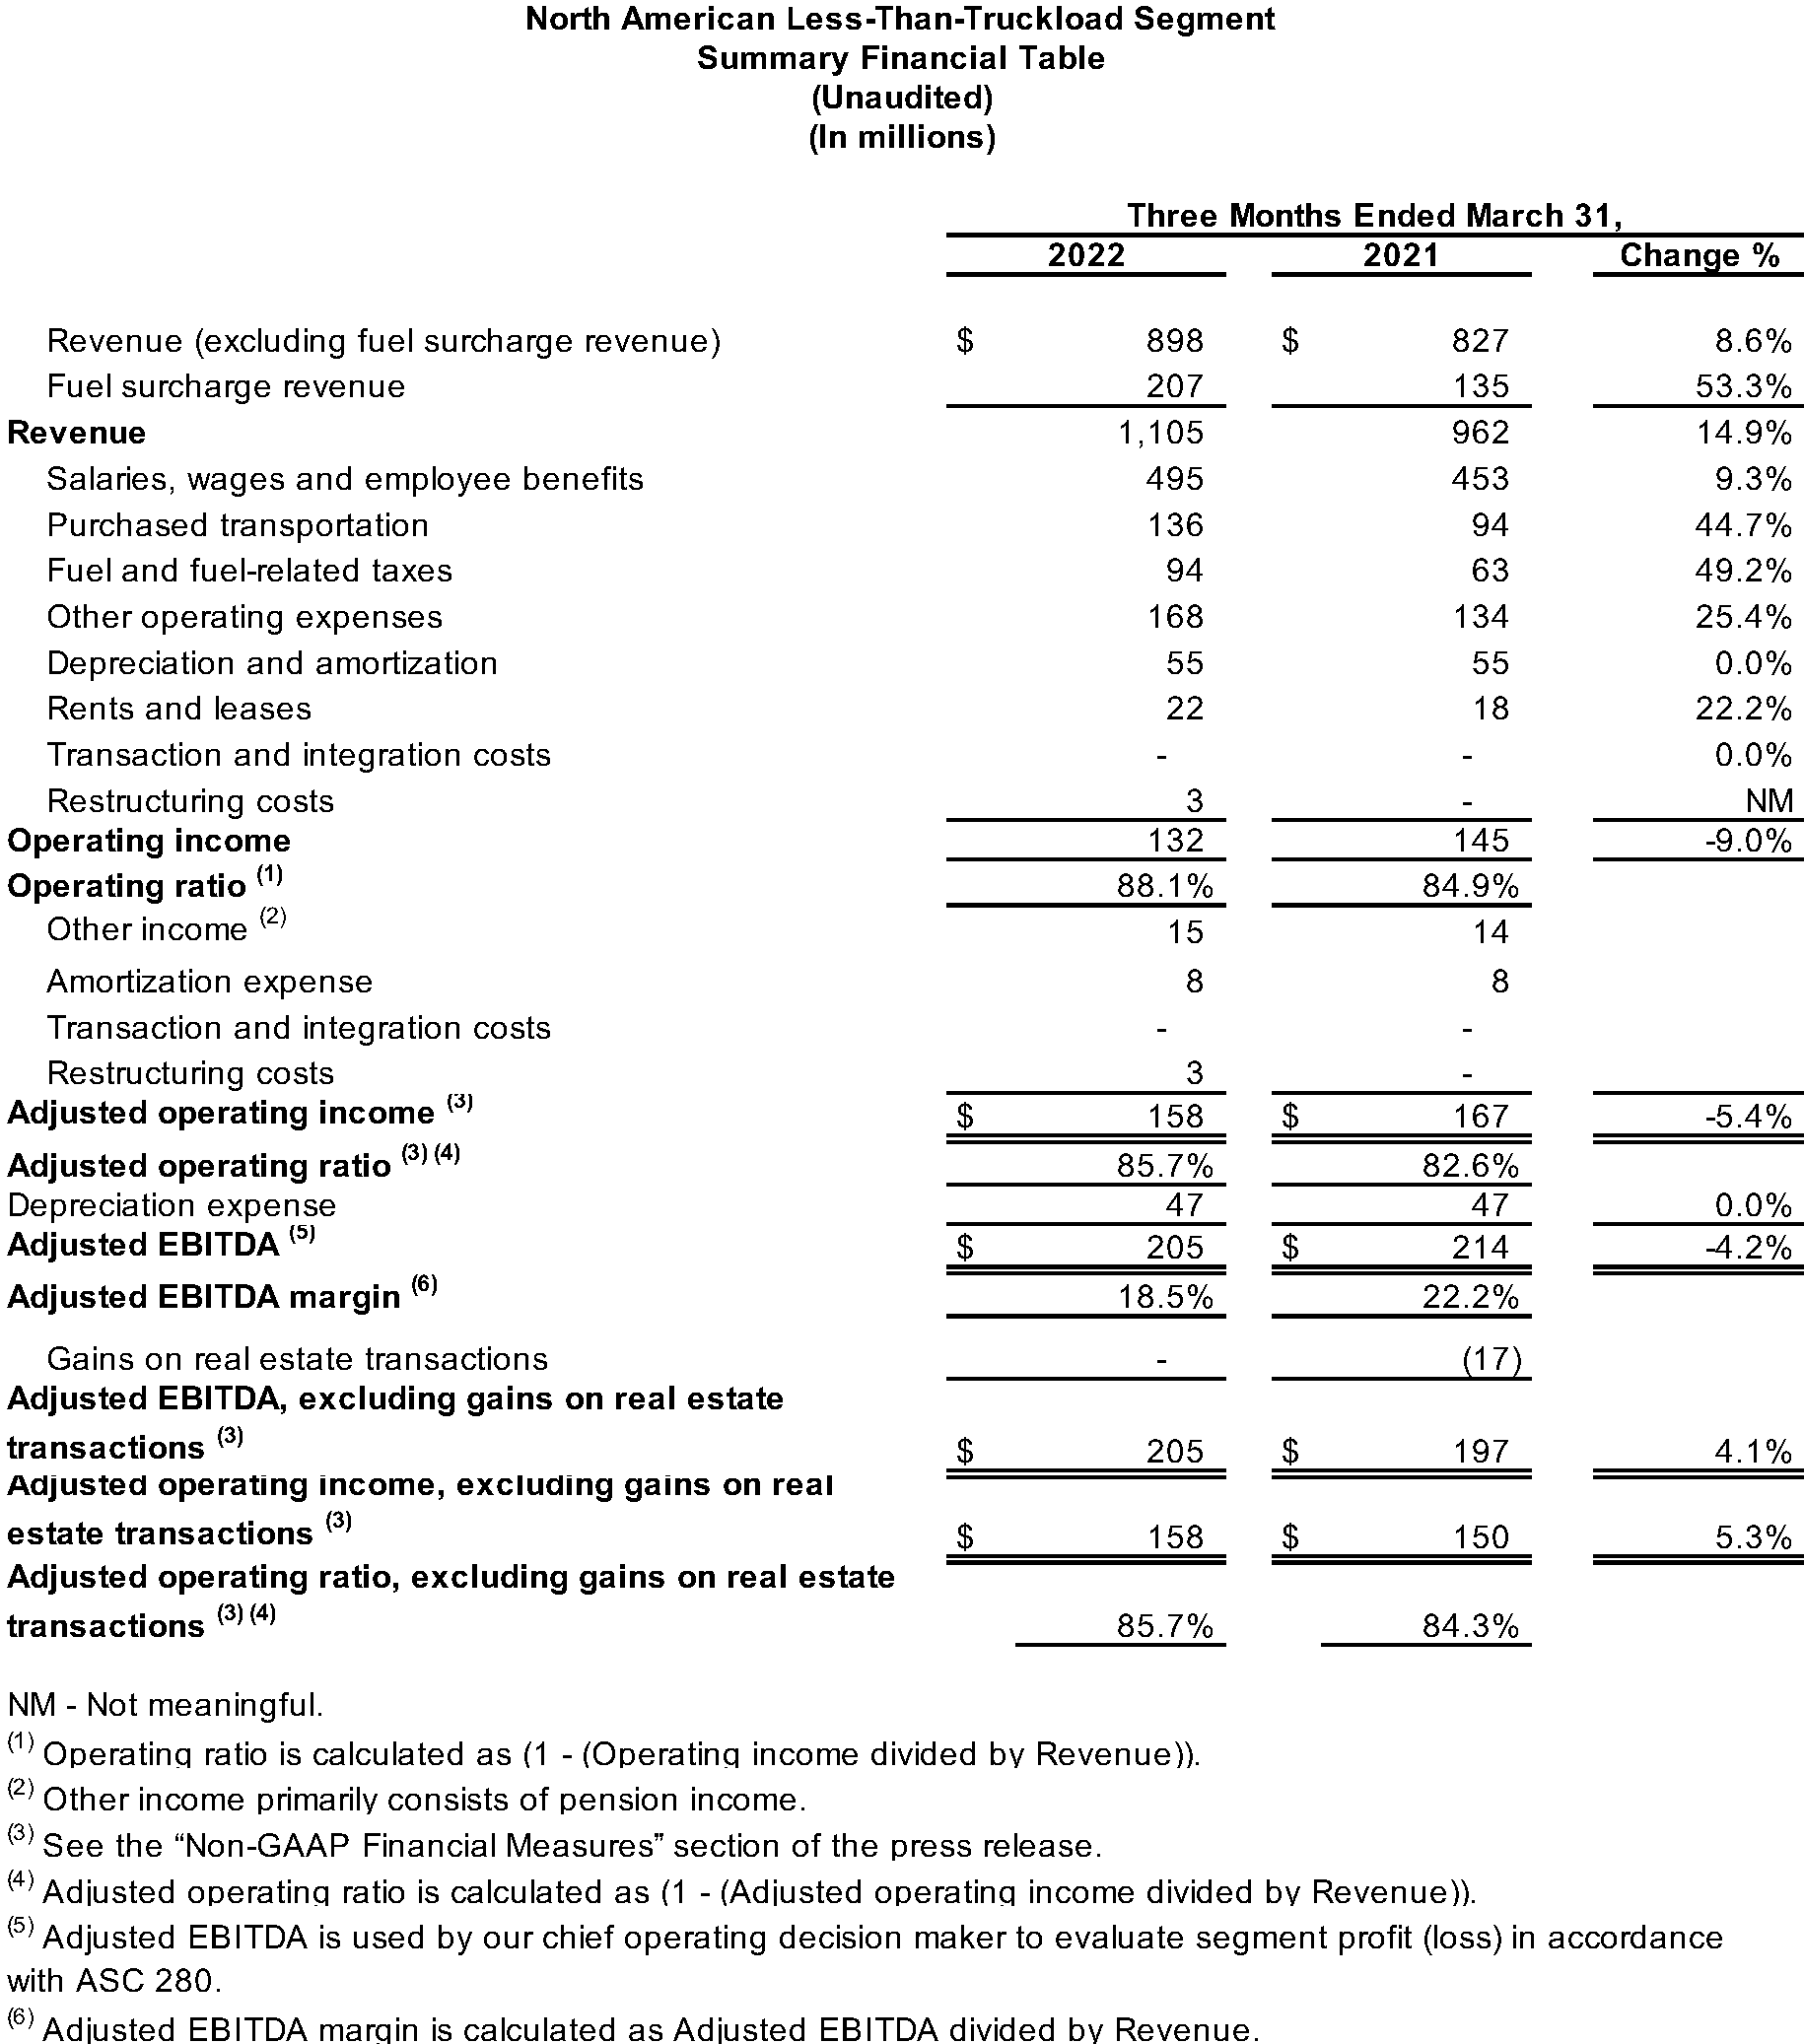
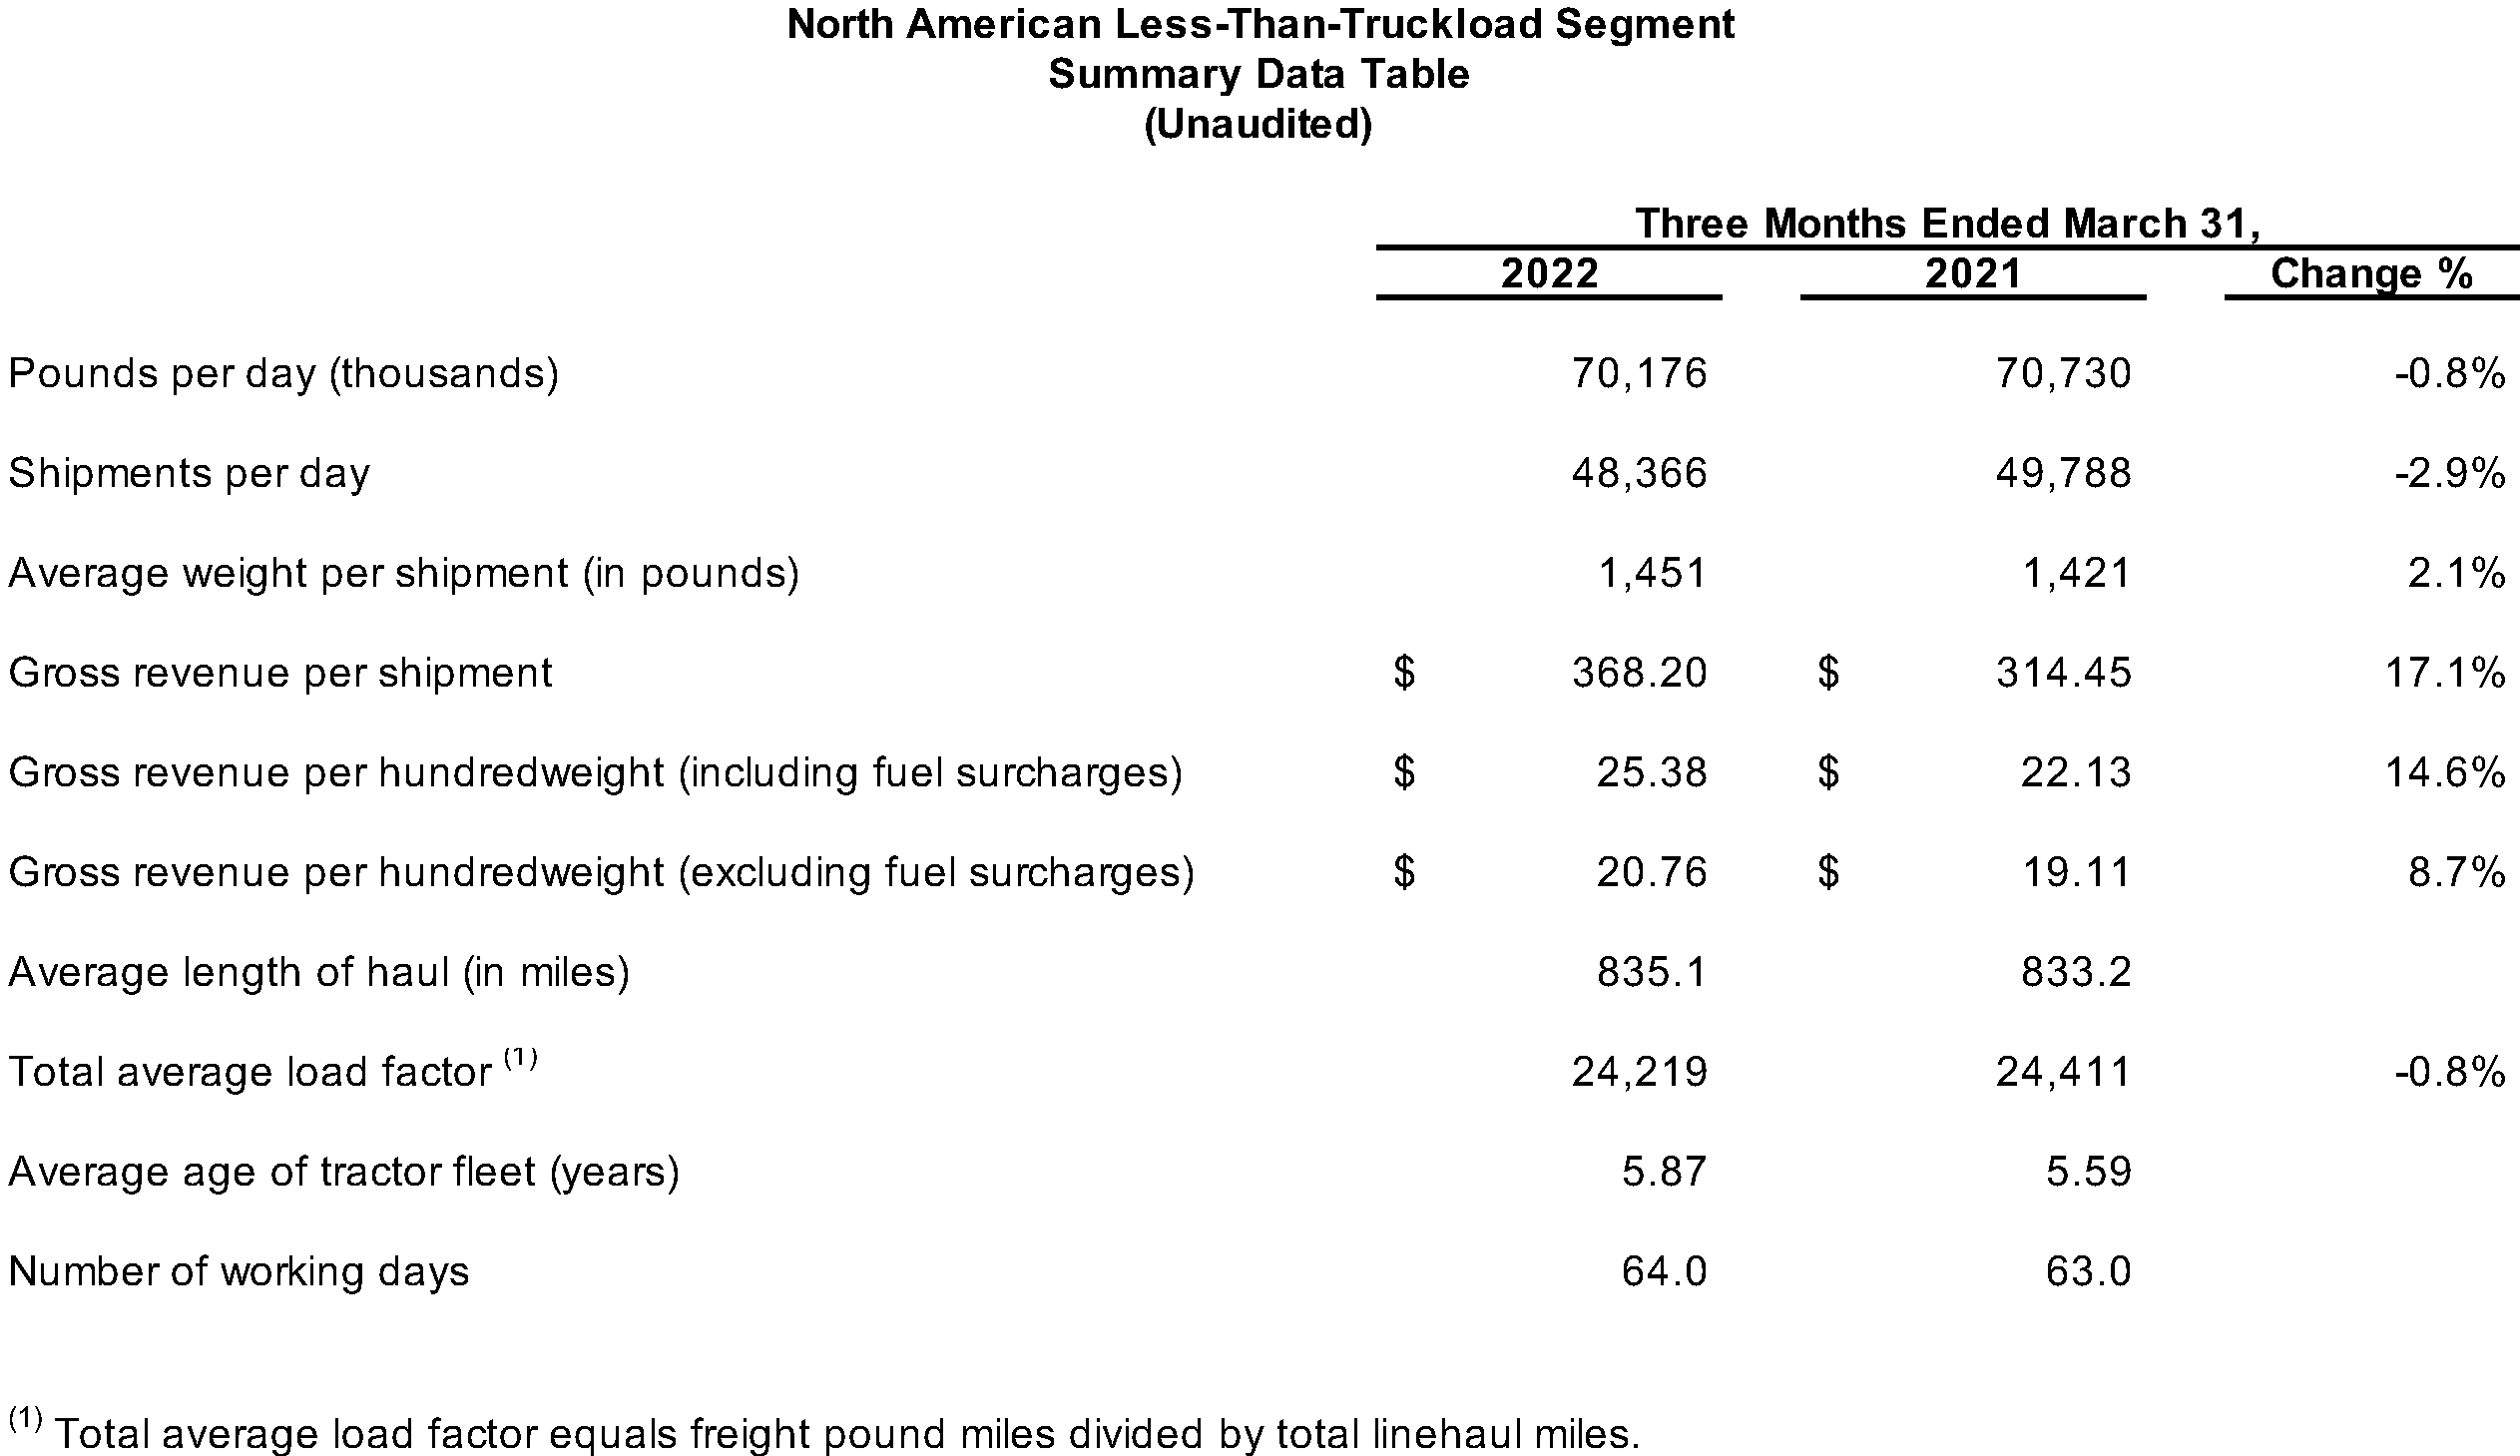
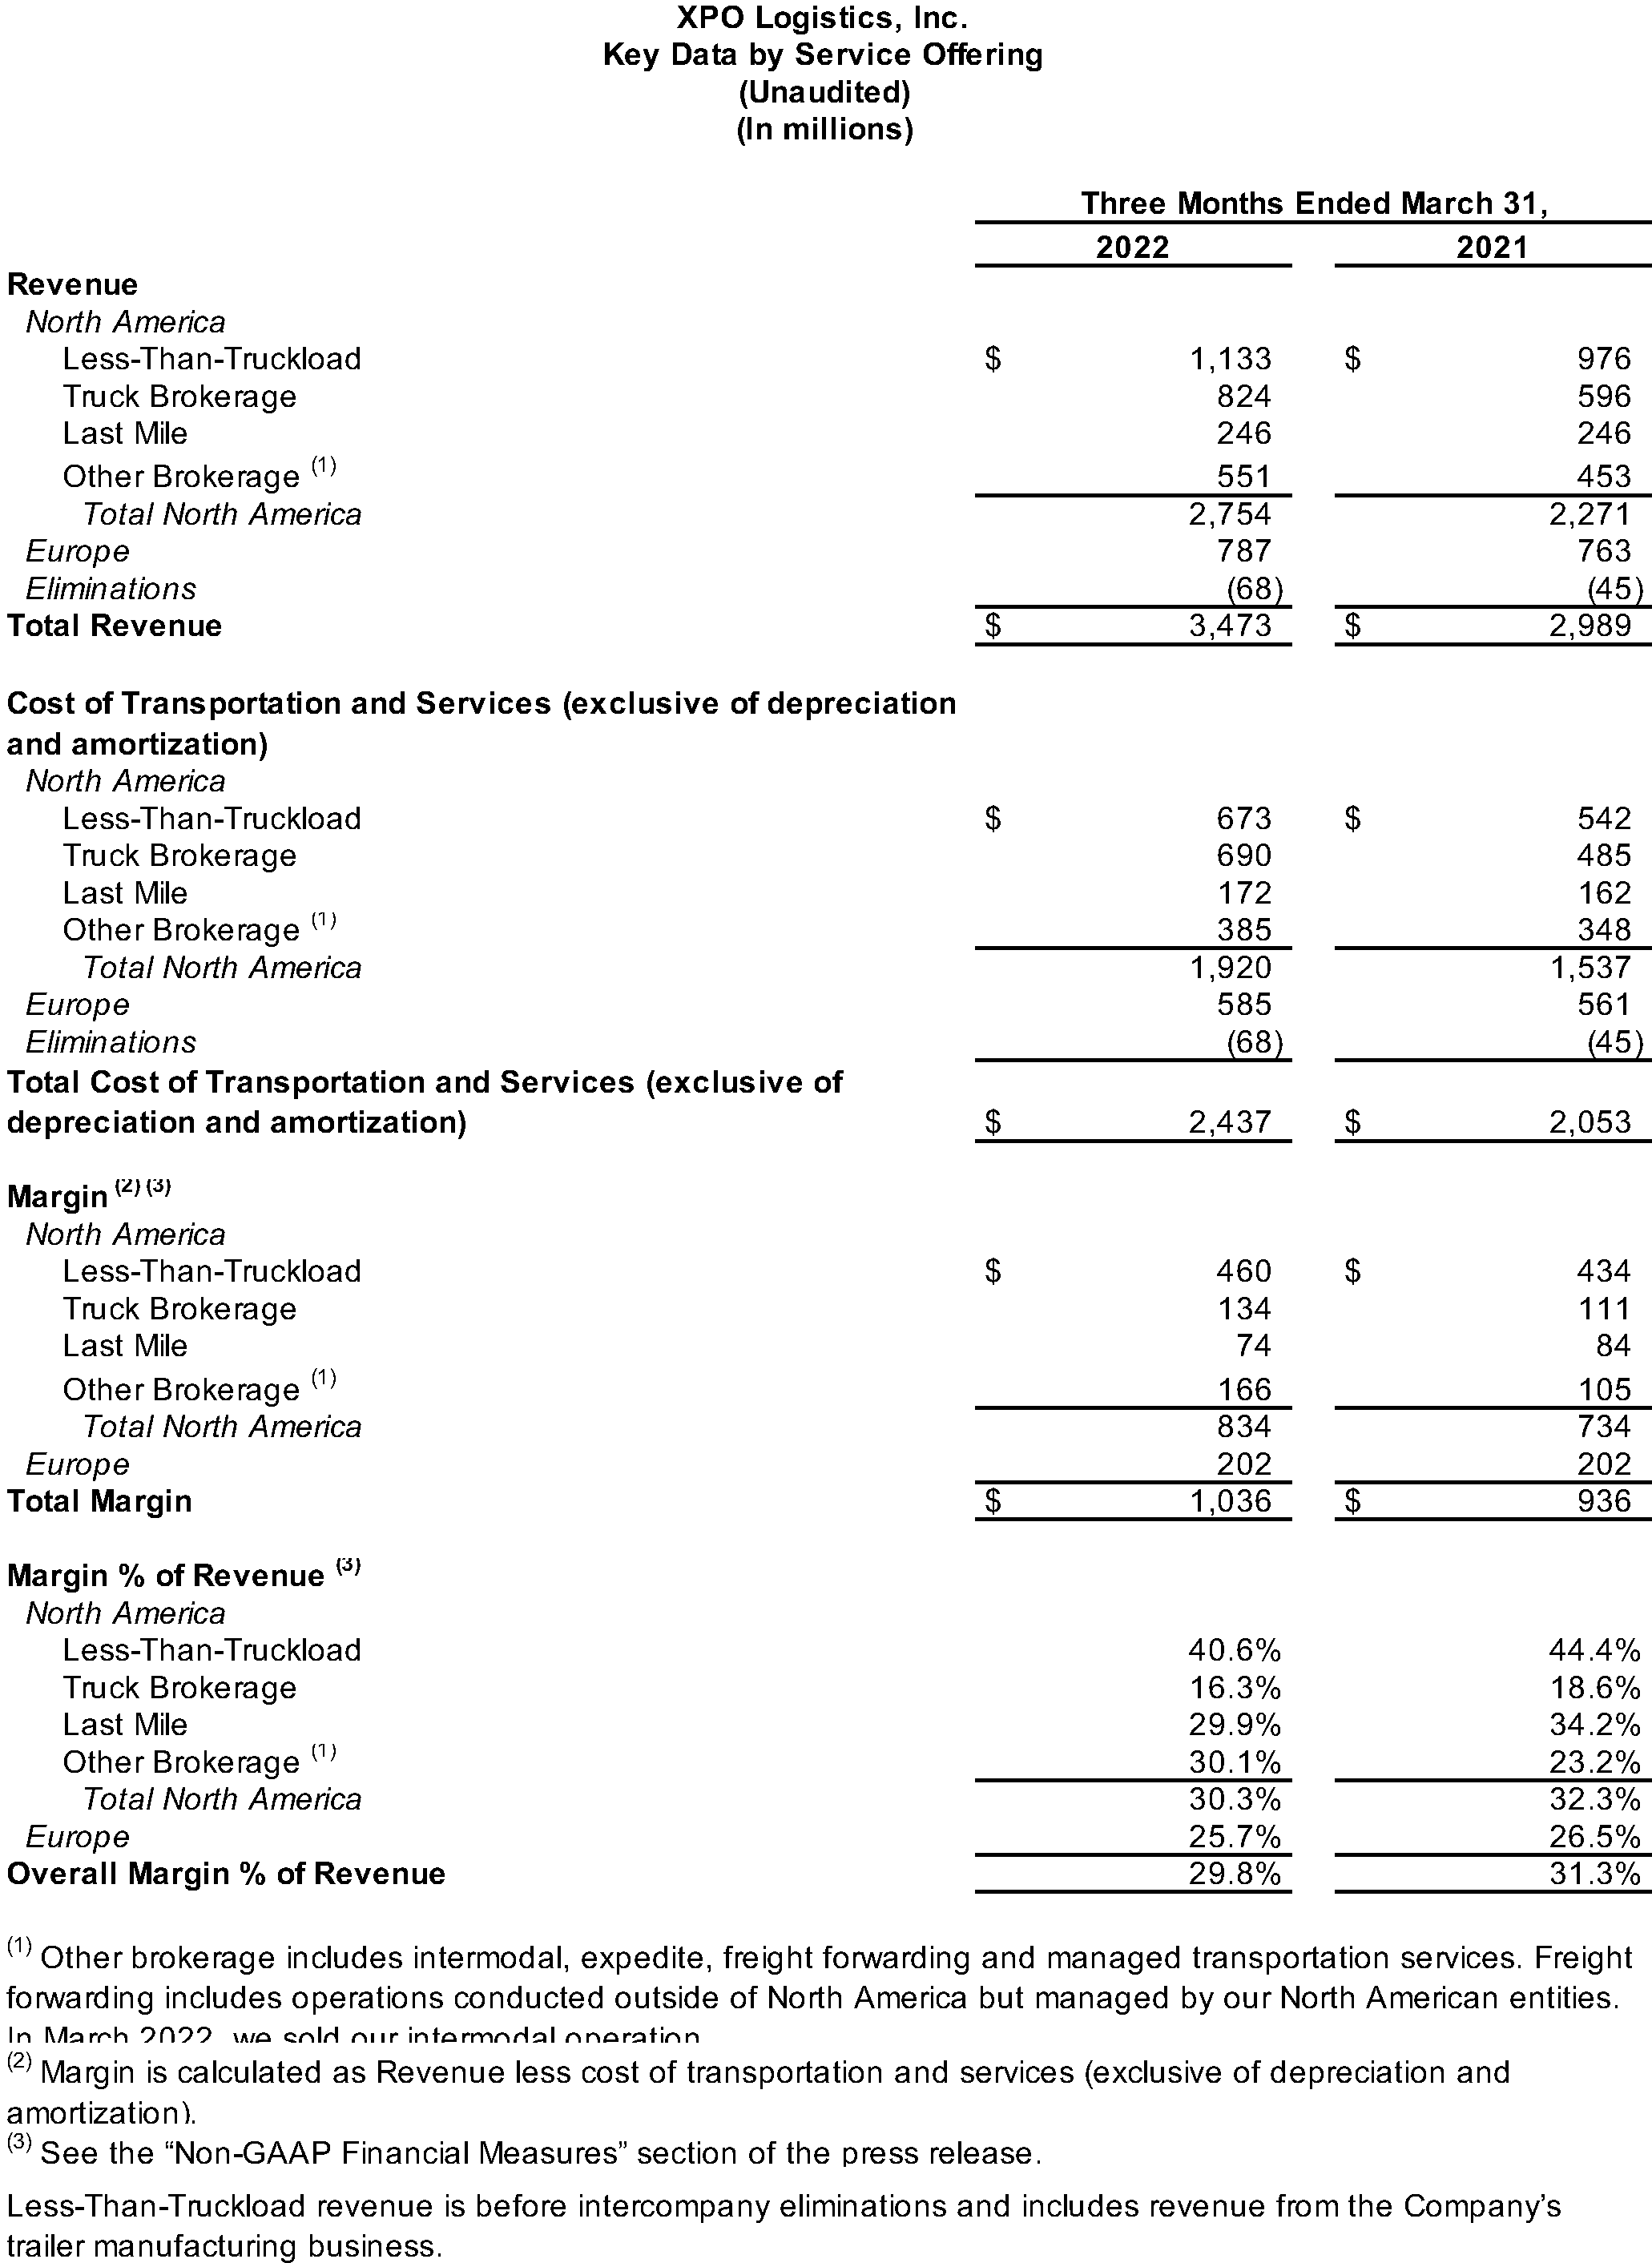
- North American Less-Than-Truckload: The segment generated revenue of $1.1 billion for the first quarter 2022, compared with $962 million for the same period in 2021. The year-over-year increase in revenue primarily reflects an increase in yield.
Operating income for the segment was $132 million for the first quarter 2022, compared with $145 million for the same period in 2021. Adjusted EBITDA for the first quarter 2022, which had no real estate sales, was $205 million, compared with $214 million, or $197 million, excluding gains on real estate sales, for the same period in 2021.
First quarter operating ratio for the LTL segment was 88.1%, and the adjusted operating ratio was 85.7%.
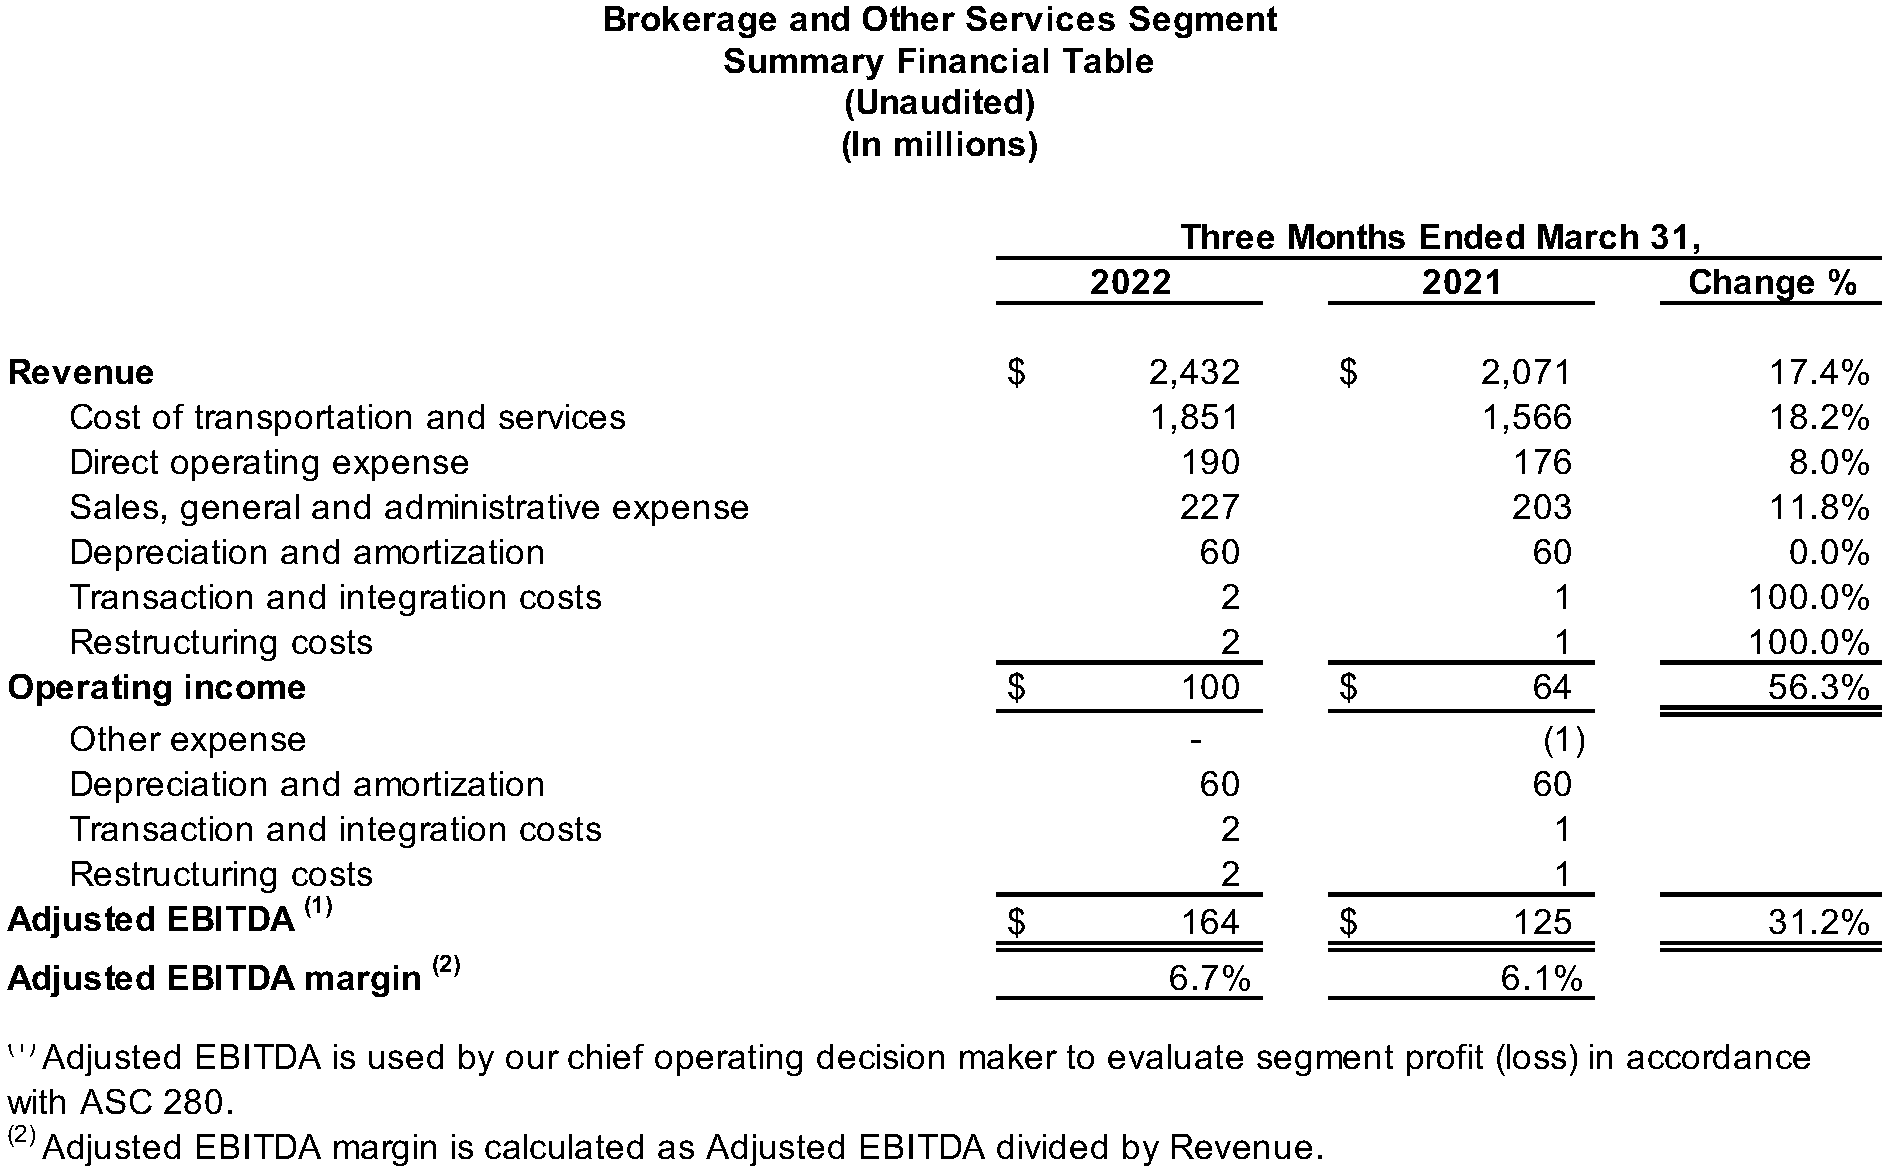
- Brokerage and Other Services: The segment generated revenue of $2.43 billion for the first quarter 2022, compared with $2.07 billion for the same period in 2021. The year-over-year increase in segment revenue reflects a significant increase in North American truck brokerage loads, facilitated by the company’s XPO Connect® digital platform, as well as strength in other brokerage services.
Operating income for the segment was $100 million for the first quarter 2022, compared with $64 million for the same period in 2021. Adjusted EBITDA was $164 million for the first quarter 2022, compared with $125 million for the same period in 2021. The year-over-year increase in adjusted EBITDA was primarily driven by volume growth in truck brokerage, and by strong pricing in other brokerage services, partially offset by higher segment costs for third-party transportation and compensation.
Truck brokerage revenue in North America increased 38% to $824 million for the first quarter, compared with $596 million for the same period in 2021. The increase in revenue was primarily driven by a 23% increase in loads in the quarter. Margin (revenue less cost of transportation and services) increased 21% to $134 million for the quarter, compared with $111 million for the same period in 2021.
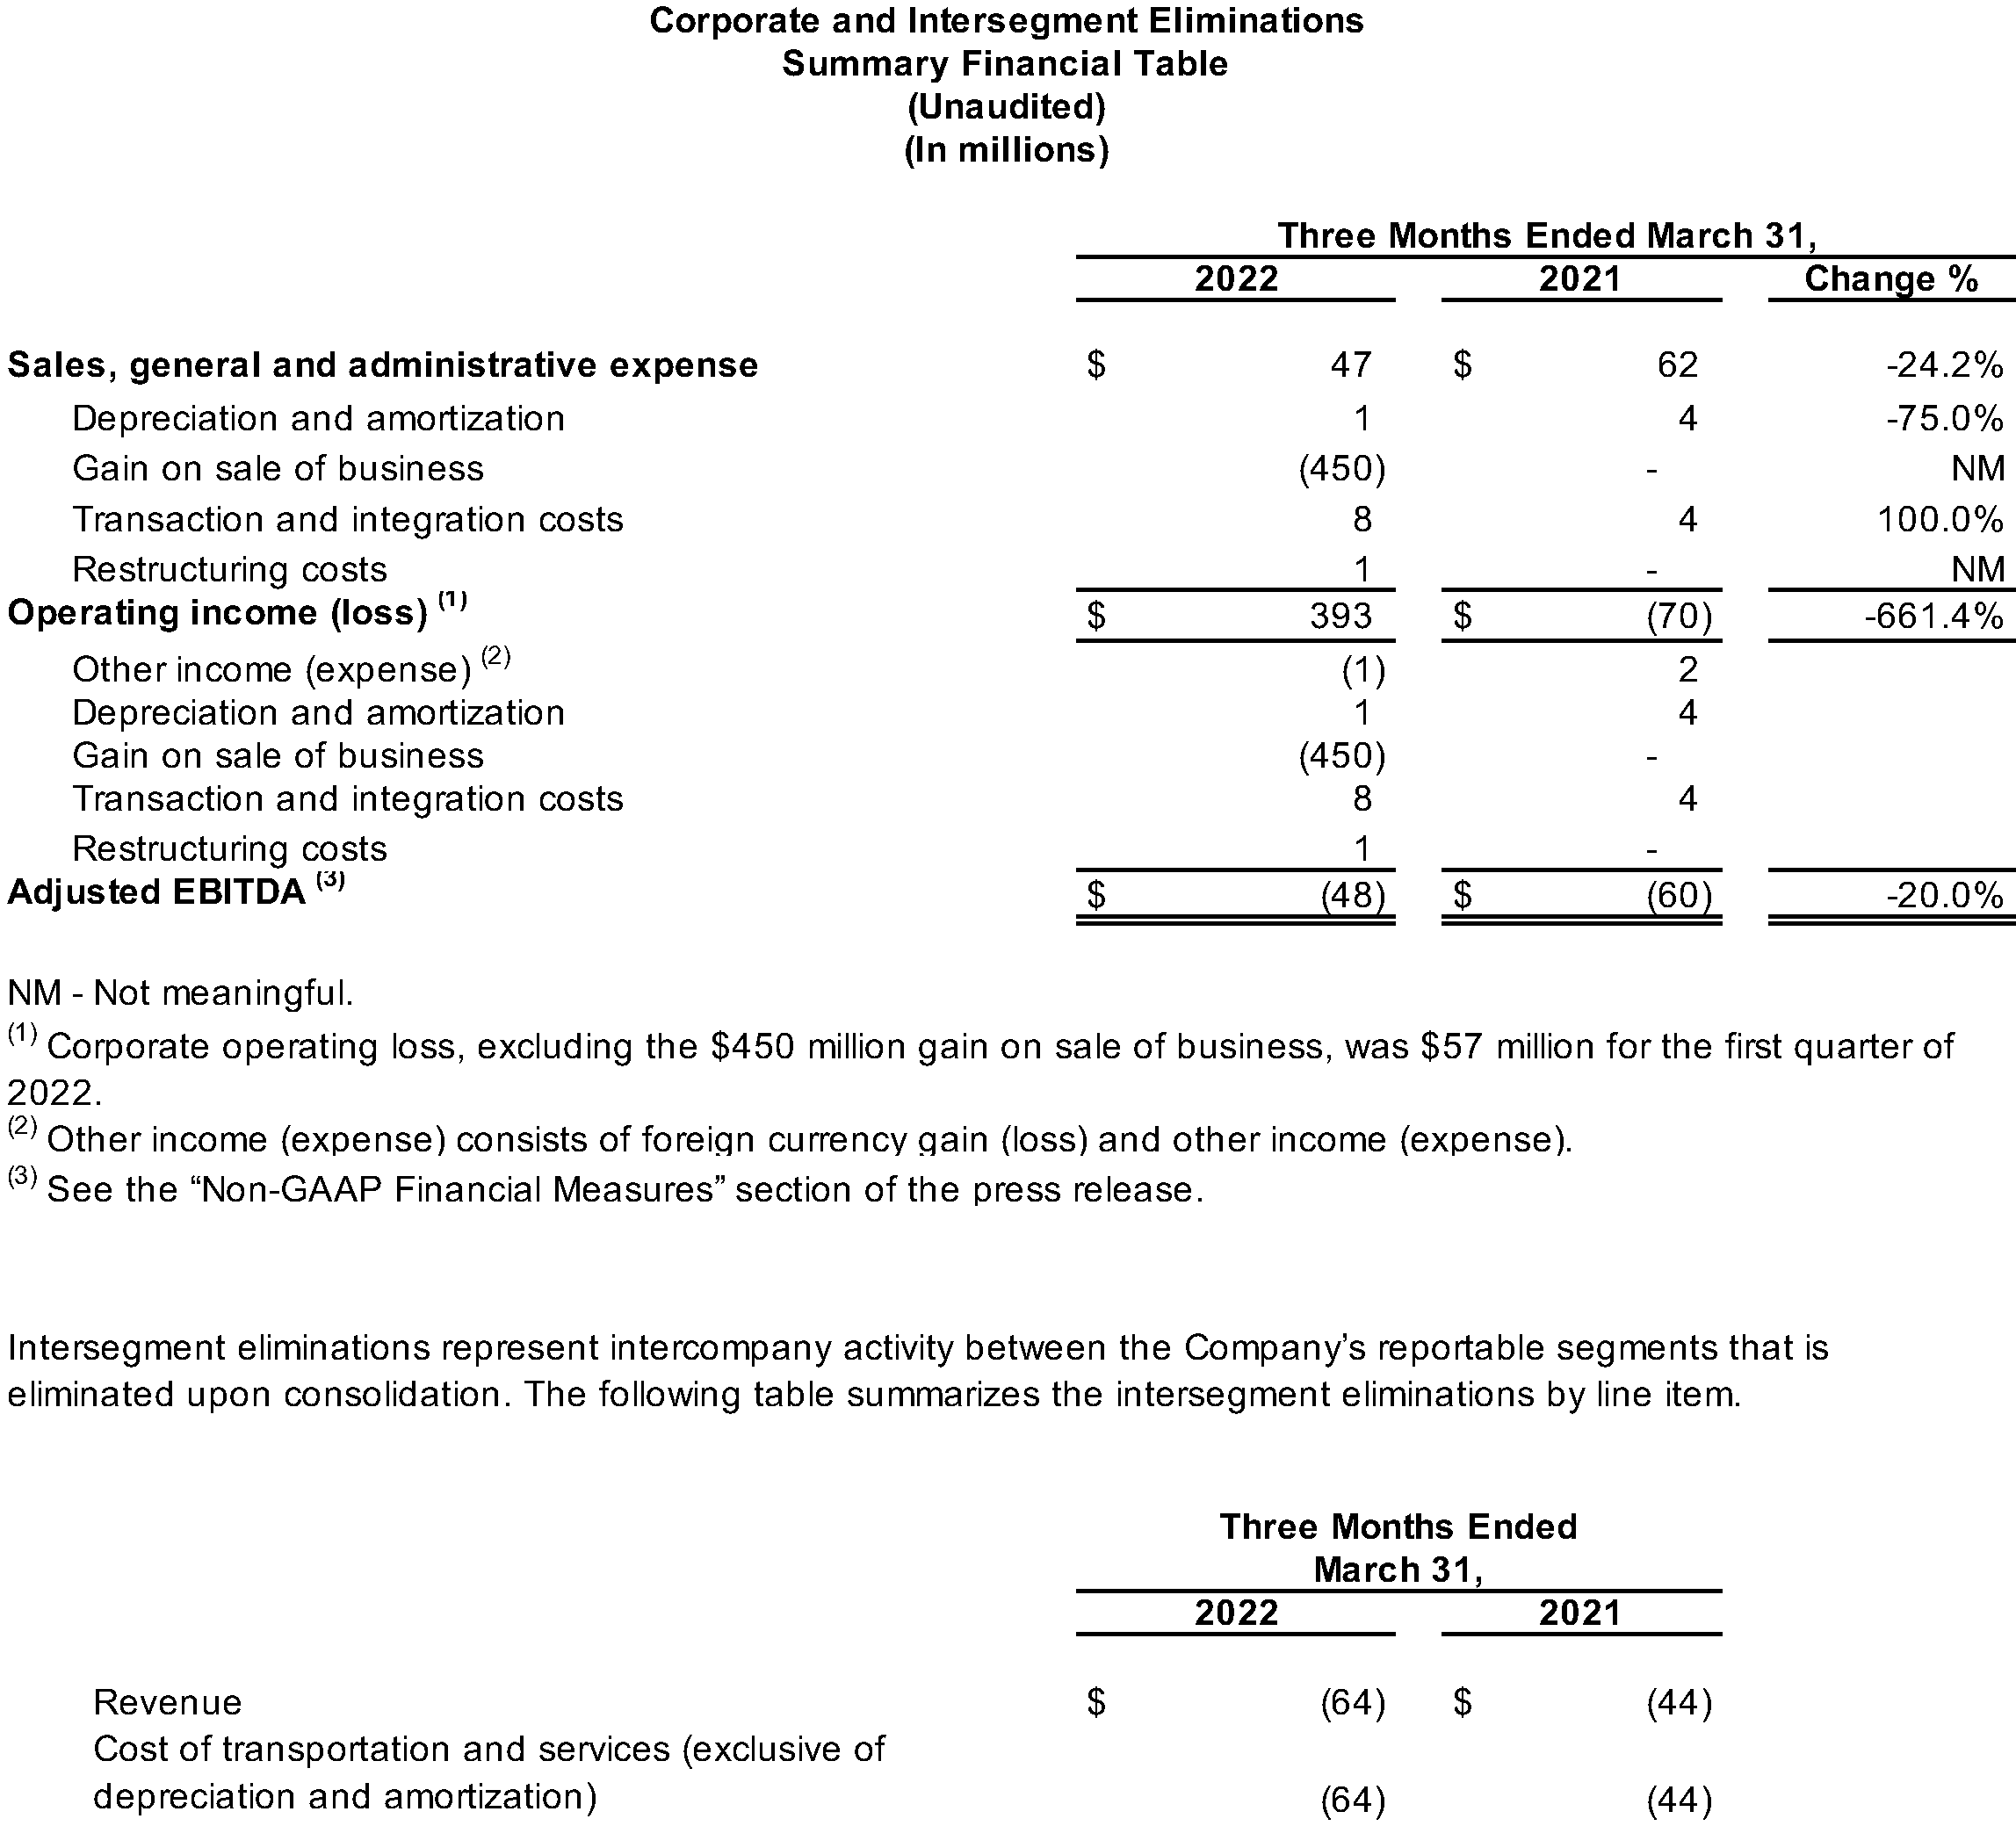
- Corporate: Corporate expense, excluding the $450 million gain on the sale of the intermodal operation, was $57 million for the first quarter 2022, compared with $70 million for the same period in 2021. Corporate adjusted EBITDA was an expense of $48 million for the first quarter 2022, compared with $60 million for the same period in 2021.
Sale of Intermodal Operation
On March 24, 2022, XPO sold its North American intermodal operation for cash proceeds of approximately $710 million, subject to a customary post-closing purchase price adjustment. The company had previously announced its intent to divest the intermodal operation as part of its 2022 strategic plan.
Liquidity Position and Deleveraging
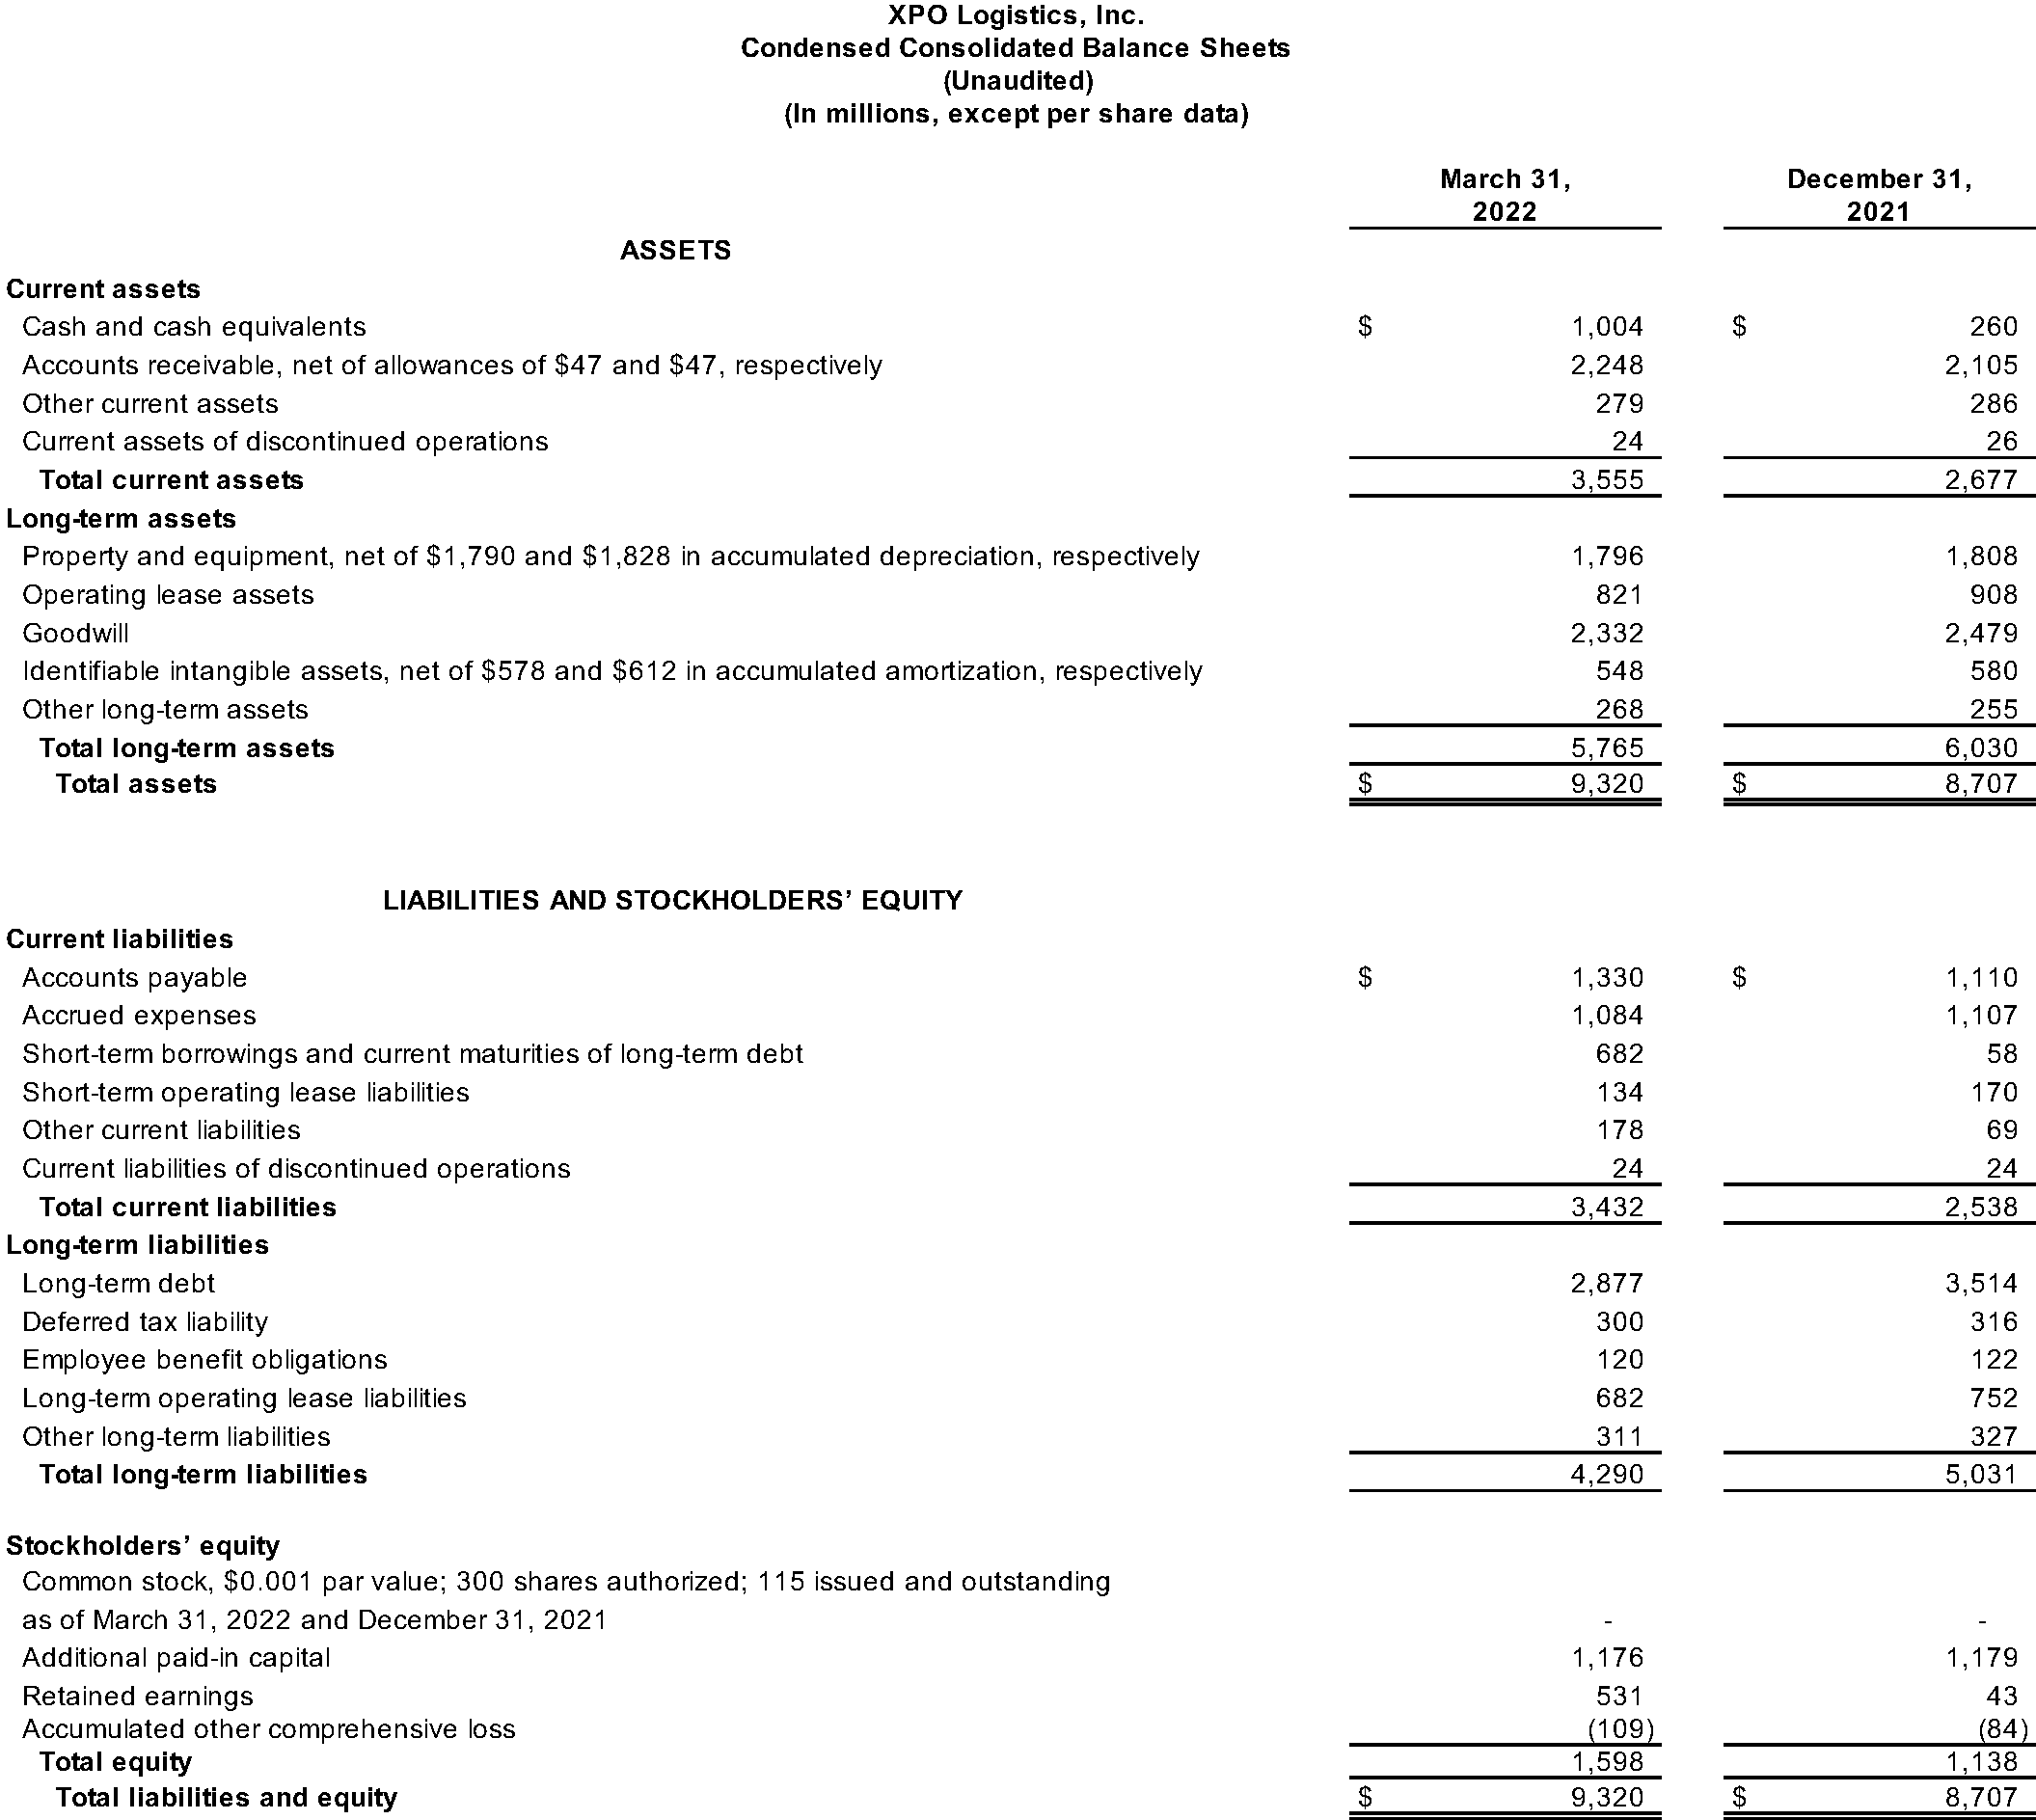
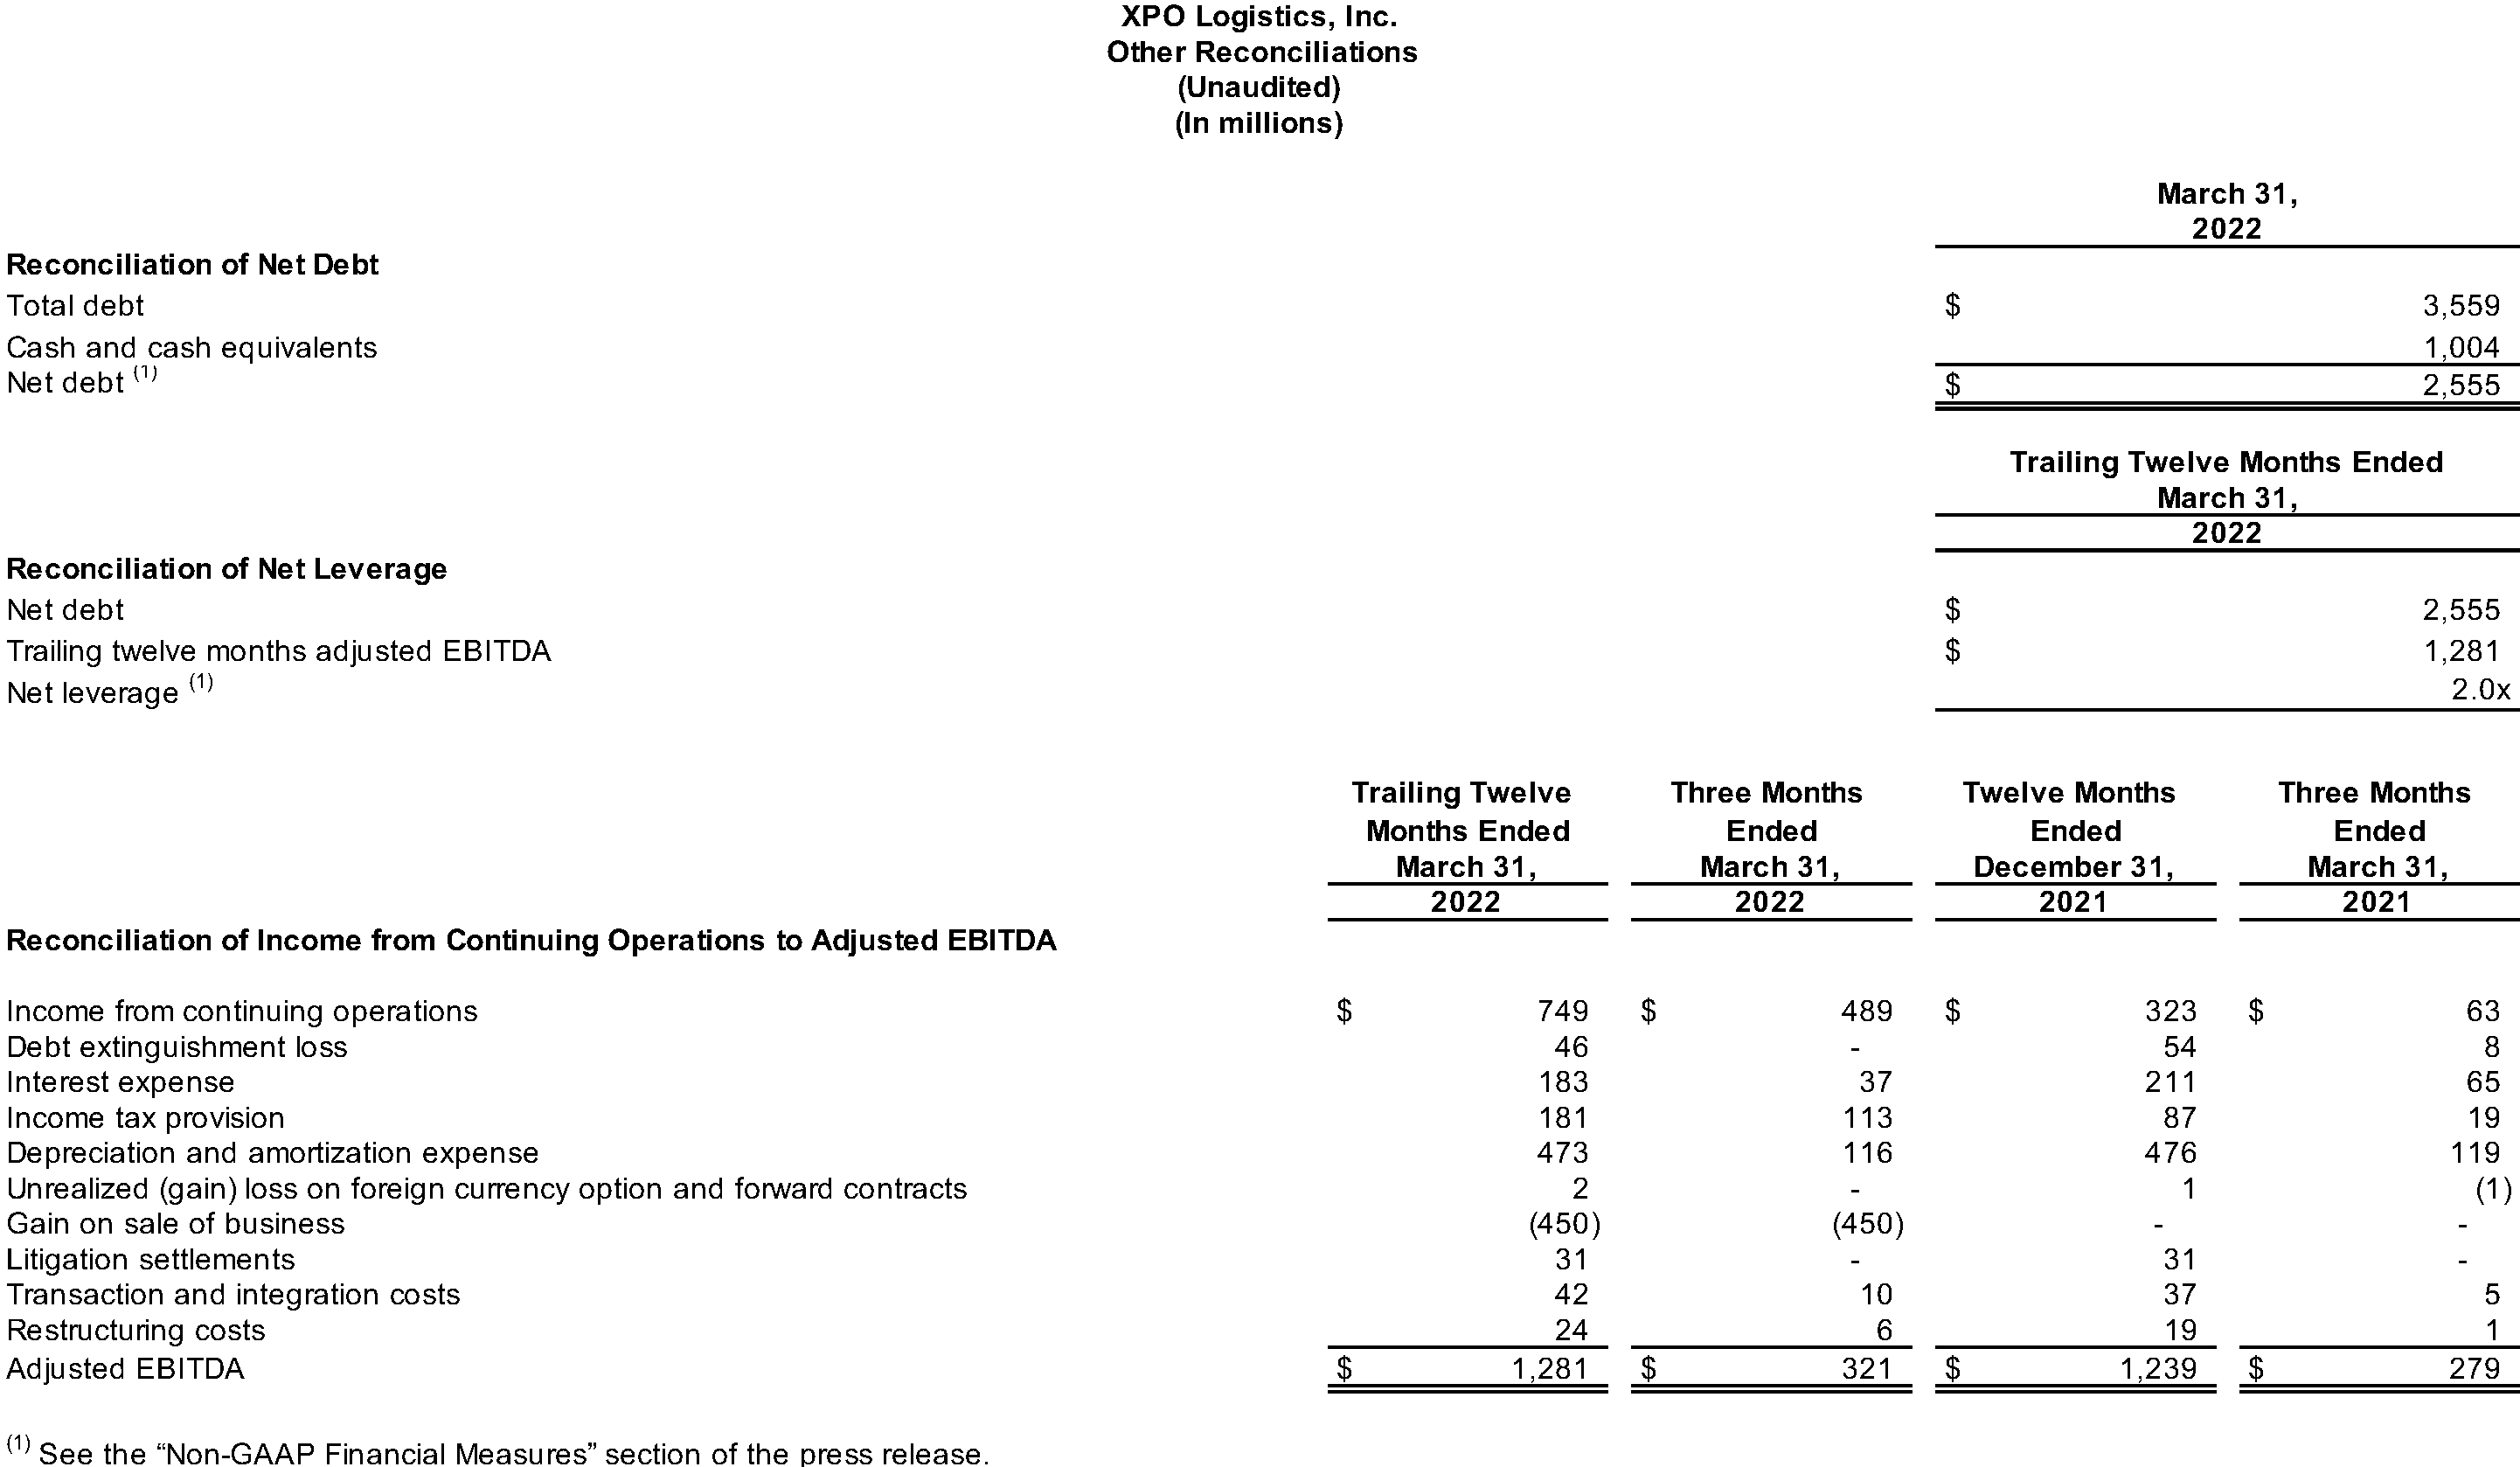
As of March 31, 2022, the company had $2.0 billion of total liquidity, including $1.0 billion of cash and cash equivalents and approximately $1.0 billion of available borrowing capacity, with a net leverage ratio of 2.0x, down from 2.7x at year-end 2021. Net leverage ratio is calculated as net debt of $2.56 billion, divided by adjusted EBITDA of $1.28 billion for the trailing 12 months ended March 31, 2022.
As previously announced, XPO is committed to reducing its net leverage ratio to 1.0x – 2.0x. On April 9, 2022, the company redeemed $630 million of the $1.15 billion in aggregate principal amount of its outstanding 6.250% Senior Notes due 2025. The March sale of the intermodal operation and the April debt paydown accelerated the pace of the company’s deleveraging plan.
Conference Call
The company will hold a conference call on Tuesday, May 10, 2022, at 8:30 a.m. Eastern Time. Participants can call toll-free (from US/Canada) 1-877-269-7756; international callers dial +1-201-689-7817. A live webcast of the conference will be available on the investor relations area of the company’s website, xpo.com/investors. The conference will be archived until June 10, 2022. To access the replay by phone, call toll-free (from US/Canada) 1-877-660-6853; international callers dial +1-201-612-7415. Use participant passcode 13728800.
About XPO Logistics
XPO Logistics, Inc. (NYSE: XPO) is a leading provider of freight transportation services, primarily less-than-truckload (LTL) and truck brokerage. XPO uses its proprietary technology, including the cutting-edge XPO Connect® automated freight marketplace, to move goods efficiently through supply chains. The company’s global network serves 50,000 shippers with approximately 731 locations and 42,000 employees, and is headquartered in Greenwich, Conn., USA. Visit xpo.com and europe.xpo.com for more information, and connect with XPO on Facebook, Twitter, LinkedIn, Instagram and YouTube.
Non-GAAP Financial Measures
As required by the rules of the Securities and Exchange Commission (“SEC”), we provide reconciliations of the non-GAAP financial measures contained in this press release to the most directly comparable measure under GAAP, which are set forth in the financial tables attached to this press release.
XPO’s non-GAAP financial measures for the three months ended March 31, 2022 and 2021 used in this press release include: adjusted earnings before interest, taxes, depreciation and amortization (“adjusted EBITDA”) on a consolidated basis and for corporate and intersegment eliminations; adjusted EBITDA margin on a consolidated basis; adjusted net income from continuing operations attributable to common shareholders and adjusted diluted earnings from continuing operations per share (“adjusted EPS”); margin (revenue less cost of transportation and services) and margin as a percentage of revenue (margin % of revenue) by service offering; free cash flows; adjusted operating income (including and excluding gains on real estate transactions) for our North American less-than-truckload segment; adjusted operating ratio (including and excluding gains on real estate transactions) for our North American less-than-truckload segment; and adjusted EBITDA excluding gains on real estate transactions for our North American Less-Than-Truckload segment. Also, XPO’s non-GAAP financial measures include net leverage for the trailing twelve months ended March 31, 2022 and net debt as of March 31, 2022.
We believe that the above adjusted financial measures facilitate analysis of our ongoing business operations because they exclude items that may not be reflective of, or are unrelated to, XPO and its business segments’ core operating performance, and may assist investors with comparisons to prior periods and assessing trends in our underlying businesses. Other companies may calculate these non-GAAP financial measures differently, and therefore our measures may not be comparable to similarly titled measures of other companies. These non-GAAP financial measures should only be used as supplemental measures of our operating performance.
Adjusted EBITDA, adjusted net income from continuing operations attributable to common shareholders and adjusted EPS include adjustments for transaction and integration costs, as well as restructuring costs and other adjustments as set forth in the attached tables. Transaction and integration adjustments are generally incremental costs that result from an actual or planned acquisition, divestiture or spin-off and may include transaction costs, consulting fees, retention awards, and internal salaries and wages (to the extent the individuals are assigned full-time to integration and transformation activities) and certain costs related to integrating and converging IT systems. Restructuring costs primarily relate to severance costs associated with business optimization initiatives. Management uses these non-GAAP financial measures in making financial, operating and planning decisions and evaluating XPO’s and each business segment’s ongoing performance.
We believe that free cash flow is an important measure of our ability to repay maturing debt or fund other uses of capital that we believe will enhance stockholder value. We calculate free cash flow as net cash provided by operating activities from continuing operations, less payment for purchases of property and equipment plus proceeds from sale of property and equipment. We believe that adjusted EBITDA and adjusted EBITDA margin improve comparability from period to period by removing the impact of our capital structure (interest and financing expenses), asset base (depreciation and amortization), litigation settlements, tax impacts and other adjustments as set out in the attached tables that management has determined are not reflective of core operating activities and thereby assist investors with assessing trends in our underlying businesses. We believe that adjusted net income from continuing operations attributable to common shareholders and adjusted EPS improve the comparability of our operating results from period to period by removing the impact of certain costs and gains that management has determined are not reflective of our core operating activities, including amortization of acquisition-related intangible assets, transaction and integration costs, restructuring costs and other adjustments as set out in the attached tables. We believe that margin (revenue less cost of transportation and services) and margin as a percentage of revenue (margin % of revenue) improve the comparability of our operating results from period to period by removing the cost of transportation and services, in particular the cost of fuel, incurred in the reporting period as set out in the attached tables. We believe that adjusted operating income and adjusted operating ratio improve the comparability of our operating results from period to period by (i) removing the impact of certain transaction and integration costs and restructuring costs, as well as amortization expenses and (ii) including the impact of pension income incurred in the reporting period as set out in the attached tables. We believe that net leverage and net debt are important measures of our overall liquidity position and are calculated by removing cash and cash equivalents from our reported total debt and reporting net debt as a ratio of our trailing twelve-month reported adjusted EBITDA.
With respect to our financial targets for full year 2022 adjusted EBITDA, adjusted diluted EPS and free cash flow, and our financial target for 2022 second quarter adjusted EBITDA, a reconciliation of these non-GAAP measures to the corresponding GAAP measures is not available without unreasonable effort due to the variability and complexity of the reconciling items described above that we exclude from these non-GAAP target measures. The variability of these items may have a significant impact on our future GAAP financial results and, as a result, we are unable to prepare the forward-looking statement of income and statement of cash flows prepared in accordance with GAAP that would be required to produce such a reconciliation.
Forward-looking Statements
This release includes forward-looking statements within the meaning of Section 27A of the Securities Act of 1933, as amended, and Section 21E of the Securities Exchange Act of 1934, as amended, including statements relating to the planned spin-off of our tech-enabled brokered services platform and the sale or listing of our European business, the expected timing of these transactions and the anticipated benefits of these transactions; our full year 2022 financial targets of consolidated adjusted EBITDA, North American LTL adjusted EBITDA and adjusted operating ratio, depreciation and amortization (excluding amortization of acquisition-related intangible assets), interest expense, tax rate, adjusted diluted EPS (excluding amortization of acquisition-related intangible assets), gross capital expenditures, net capital expenditures and free cash flow; our 2022 second quarter financial target of adjusted EBITDA; our expectation of year-over-year improvement of more than 100 basis points in North American LTL adjusted operating ratio; our 2022 financial target of at least $1 billion of adjusted EBITDA in the North American LTL segment; and our ability to reduce our net leverage ratio. All statements other than statements of historical fact are, or may be deemed to be, forward-looking statements. In some cases, forward-looking statements can be identified by the use of forward-looking terms such as “anticipate,” “estimate,” “believe,” “continue,” “could,” “intend,” “may,” “plan,” “potential,” “predict,” “should,” “will,” “expect,” “objective,” “projection,” “forecast,” “goal,” “guidance,” “outlook,” “effort,” “target,” “trajectory” or the negative of these terms or other comparable terms. However, the absence of these words does not mean that the statements are not forward-looking. These forward-looking statements are based on certain assumptions and analyses made by us in light of our experience and our perception of historical trends, current conditions and expected future developments, as well as other factors we believe are appropriate in the circumstances.
These forward-looking statements are subject to known and unknown risks, uncertainties and assumptions that may cause actual results, levels of activity, performance or achievements to be materially different from any future results, levels of activity, performance or achievements expressed or implied by such forward-looking statements. Factors that might cause or contribute to a material difference include our ability to effect the spin-off of our tech-enabled brokered services platform and meet the related conditions of the spin-off, our ability to complete the sale or listing of our European business, the expected timing of the completion of these transactions and the terms of the transactions, our ability to achieve the expected benefits of the transactions, our ability to retain and attract key personnel for the separate businesses, the risks discussed in our filings with the SEC, and the following: economic conditions generally; the severity, magnitude, duration and aftereffects of the COVID-19 pandemic, including supply chain disruptions due to plant and port shutdowns and transportation delays, the global shortage of certain components such as semiconductor chips, strains on production or extraction of raw materials, cost inflation and labor and equipment shortages, which may lower levels of service, including the timeliness, productivity and quality of service, and government responses to these factors; our ability to align our investments in capital assets, including equipment, service centers and warehouses, to our customers’ demands; our ability to implement our cost and revenue initiatives; the effectiveness of our action plan, and other management actions, to improve our North American LTL business; our ability to benefit from a sale, spin-off or other divestiture of one or more business units, and the impact of anticipated material compensation and other expenses, including expenses related to the acceleration of equity awards, to be incurred in connection with a substantial disposition; our ability to successfully integrate and realize anticipated synergies, cost savings and profit improvement opportunities with respect to acquired companies; goodwill impairment, including in connection with a business unit sale, spin-off or other divestiture; matters related to our intellectual property rights; fluctuations in currency exchange rates; fuel price and fuel surcharge changes; natural disasters, terrorist attacks, wars or similar incidents, including the conflict between Russia and Ukraine and increased tensions between Taiwan and China; risks and uncertainties regarding the expected benefits of the spin-off of our logistics segment or a future spin-off of a business unit, the impact of the spin-off of our logistics segment or a future spin-off of a business unit on the size and business diversity of our company; the ability of the spin-off of our logistics segment or a future spin-off of a business unit to qualify for tax-free treatment for U.S. federal income tax purposes; our ability to develop and implement suitable information technology systems and prevent failures in or breaches of such systems; our indebtedness; our ability to raise debt and equity capital; fluctuations in fixed and floating interest rates; our ability to maintain positive relationships with our network of third-party transportation providers; our ability to attract and retain qualified drivers; labor matters, including our ability to manage our subcontractors, and risks associated with labor disputes at our customers and efforts by labor organizations to organize our employees and independent contractors; litigation, including litigation related to alleged misclassification of independent contractors and securities class actions; risks associated with our self-insured claims; risks associated with defined benefit plans for our current and former employees; the impact of potential sales of common stock by our chairman; governmental regulation, including trade compliance laws, as well as changes in international trade policies, sanctions and tax regimes; governmental or political actions, including the United Kingdom’s exit from the European Union; and competition and pricing pressures.
All forward-looking statements set forth in this release are qualified by these cautionary statements and there can be no assurance that the actual results or developments anticipated by us will be realized or, even if substantially realized, that they will have the expected consequences to or effects on us or our business or operations. Forward-looking statements set forth in this release speak only as of the date hereof, and we do not undertake any obligation to update forward-looking statements to reflect subsequent events or circumstances, changes in expectations or the occurrence of unanticipated events, except to the extent required by law.
Where required by law, no binding decision will be made with respect to the divestiture of the European business other than in compliance with applicable employee information and consultation requirements.