XPO Logistics Announces Third Quarter 2019 Results
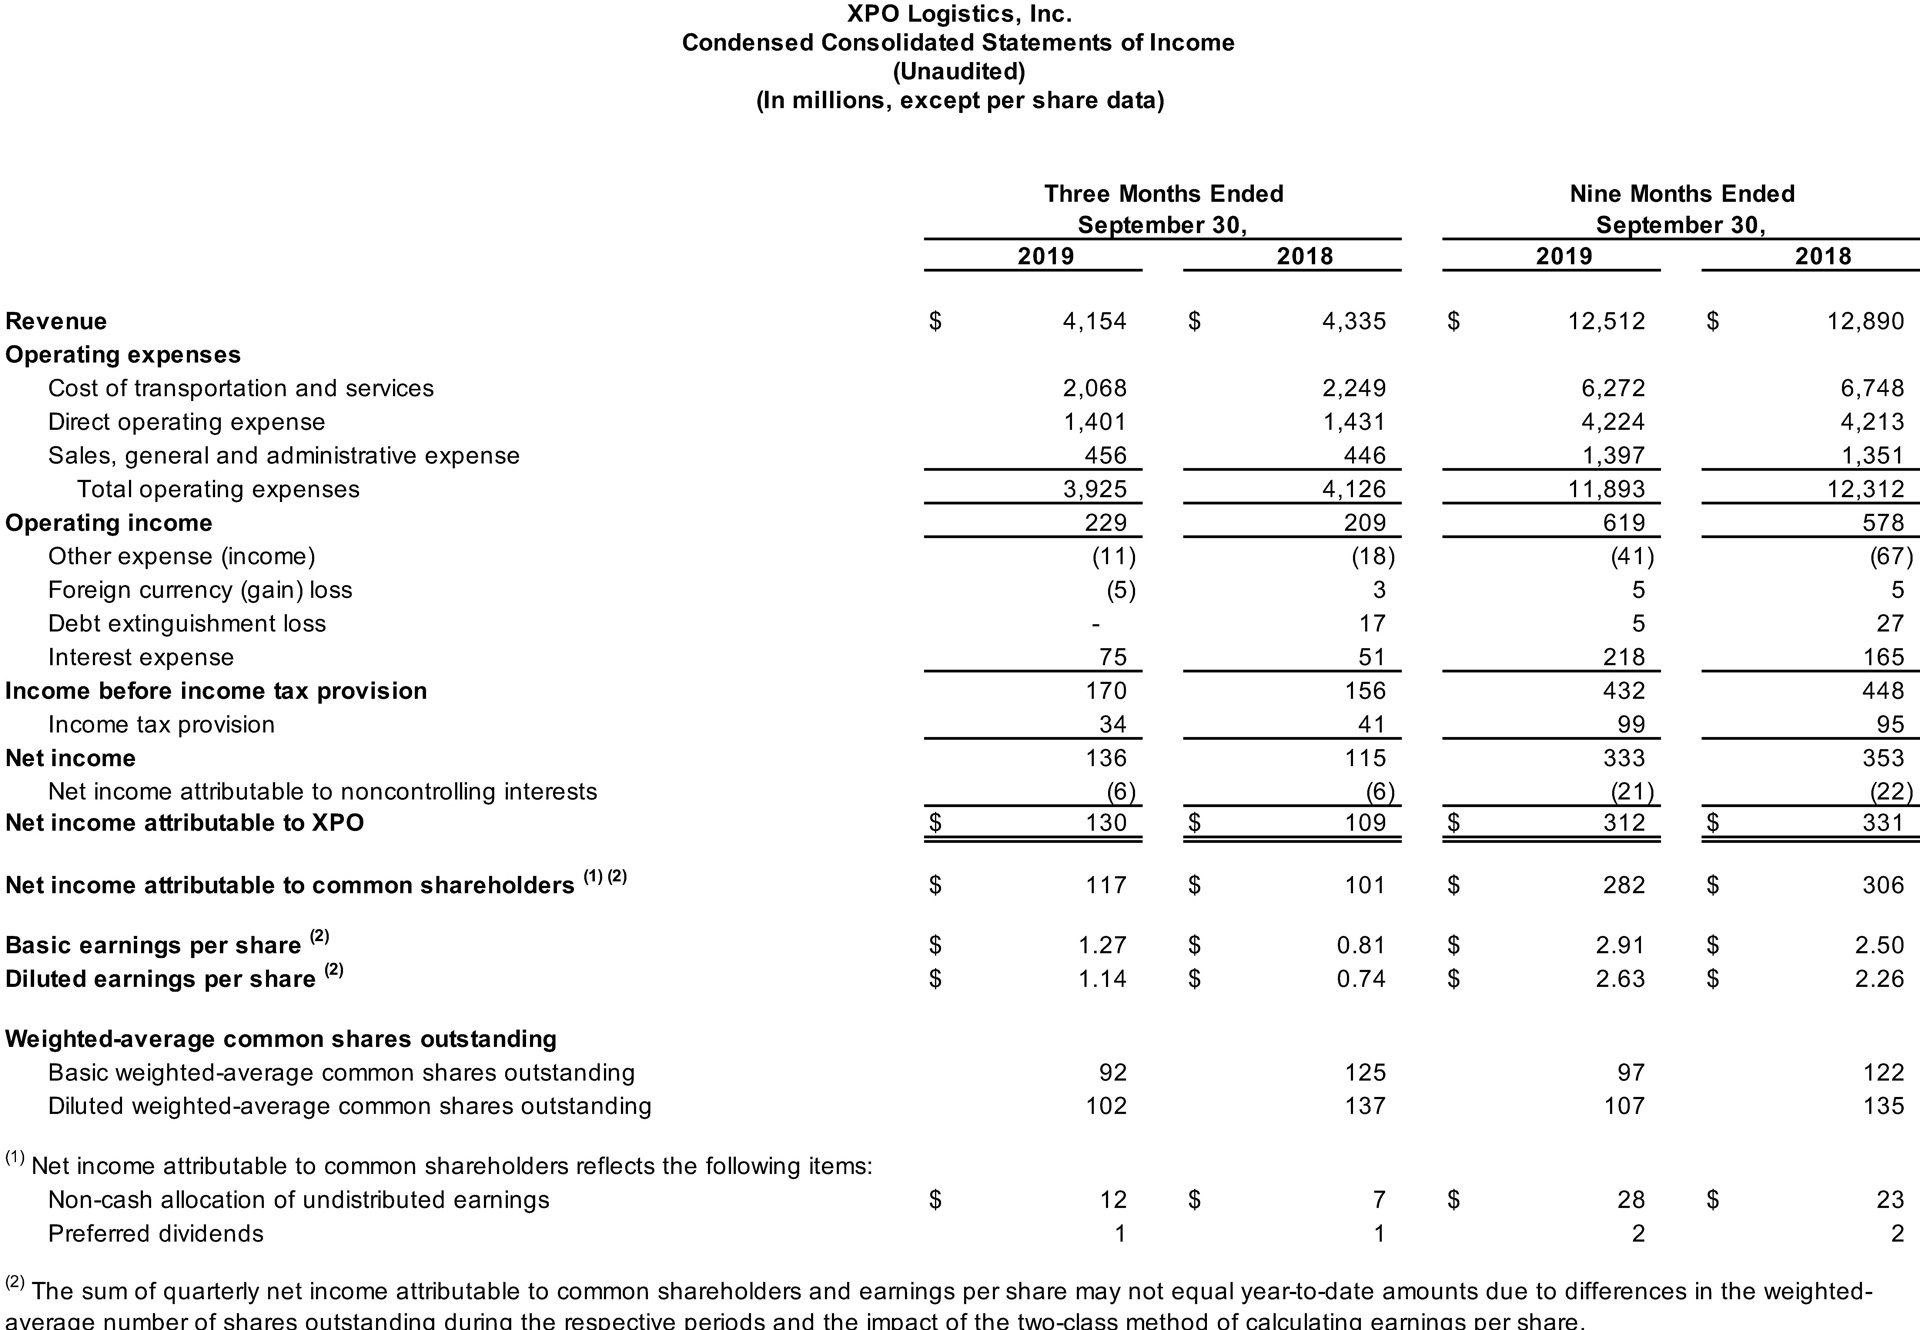
XPO Logistics, Inc. (NYSE: XPO) today announced financial results for the third quarter 2019. Revenue was $4.15 billion for the quarter, compared with $4.34 billion for the same period in 2018. Net income attributable to common shareholders was $117 million for the quarter, compared with $101 million for the same period in 2018. Operating income was $229 million for the quarter, compared with $209 million for the same period in 2018. Diluted earnings per share was $1.14 for the quarter, compared with $0.74 for the same period in 2018.
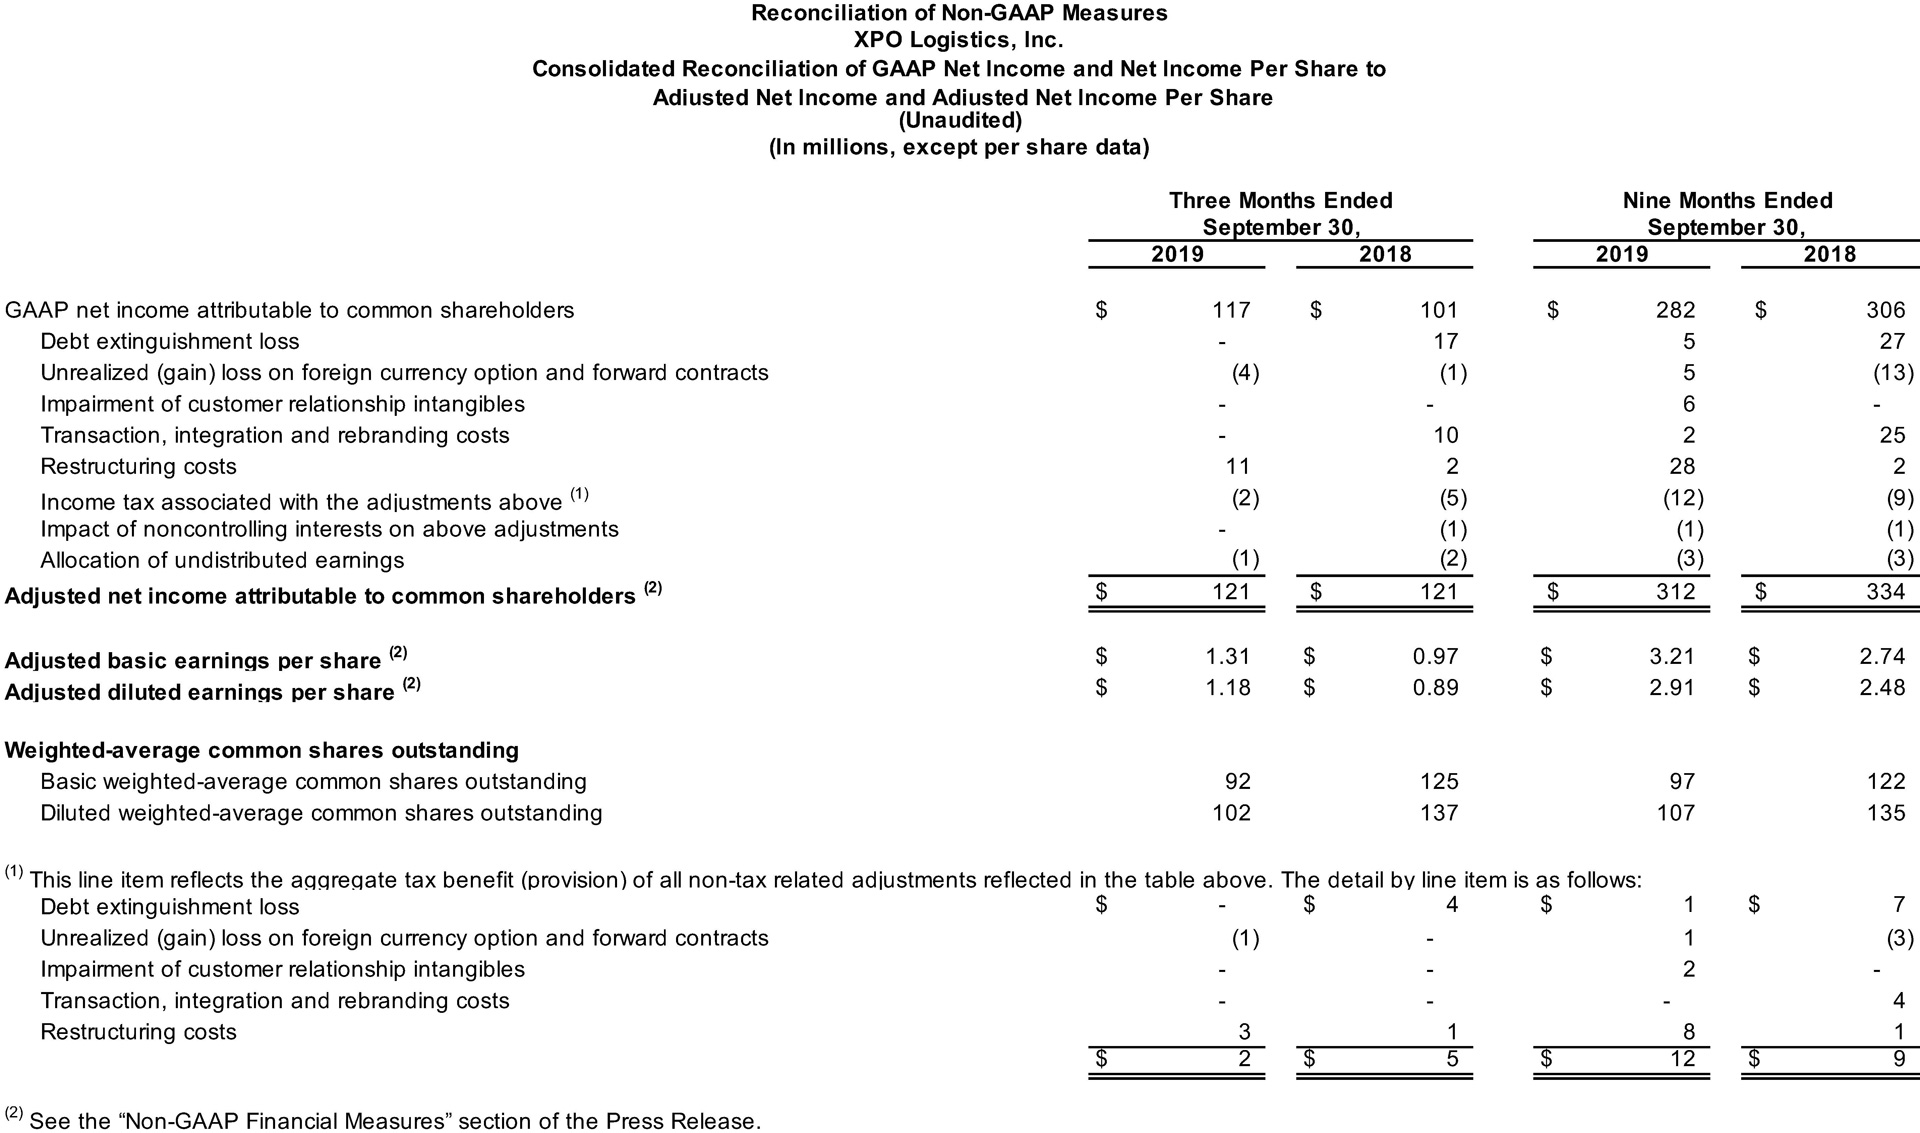
Adjusted net income attributable to common shareholders, a non-GAAP financial measure, was $121 million for the third quarter 2019, unchanged from the same period a year ago. Adjusted diluted earnings per share, a non-GAAP financial measure, was $1.18 for the quarter, compared with $0.89 for the same period in 2018.
Adjusted net income attributable to common shareholders and adjusted diluted earnings per share for the third quarter 2019 exclude: $11 million, or $8 million after-tax, of restructuring costs, primarily severance; and a benefit of $4 million, or $3 million after-tax, of non-cash unrealized gains on foreign currency contracts.
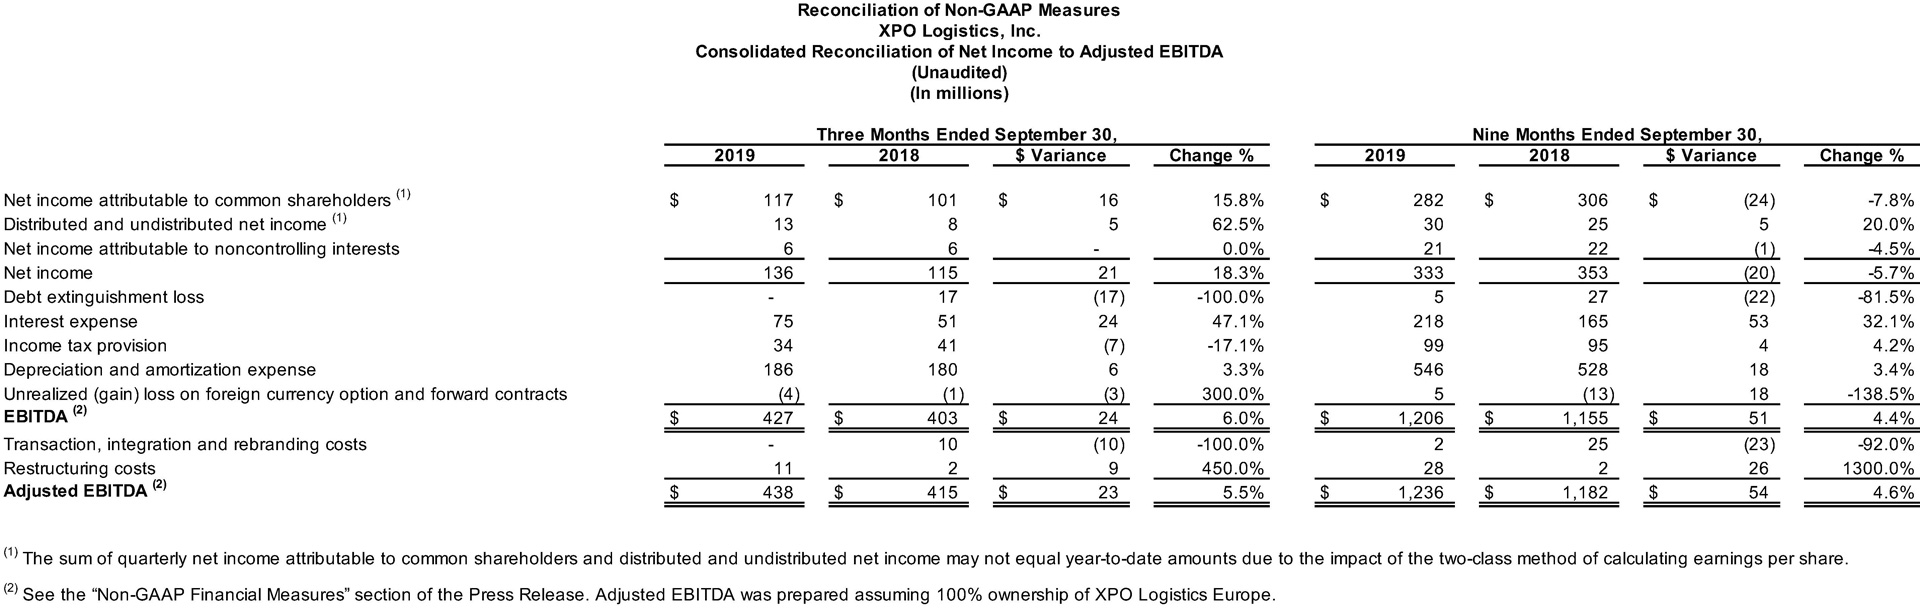
Adjusted earnings before interest, taxes, depreciation and amortization ("adjusted EBITDA"), a non-GAAP financial measure, increased to $438 million for the third quarter 2019, compared with $415 million for the same period in 2018. Adjusted EBITDA for the third quarter 2019 excludes $11 million of restructuring costs, primarily severance.
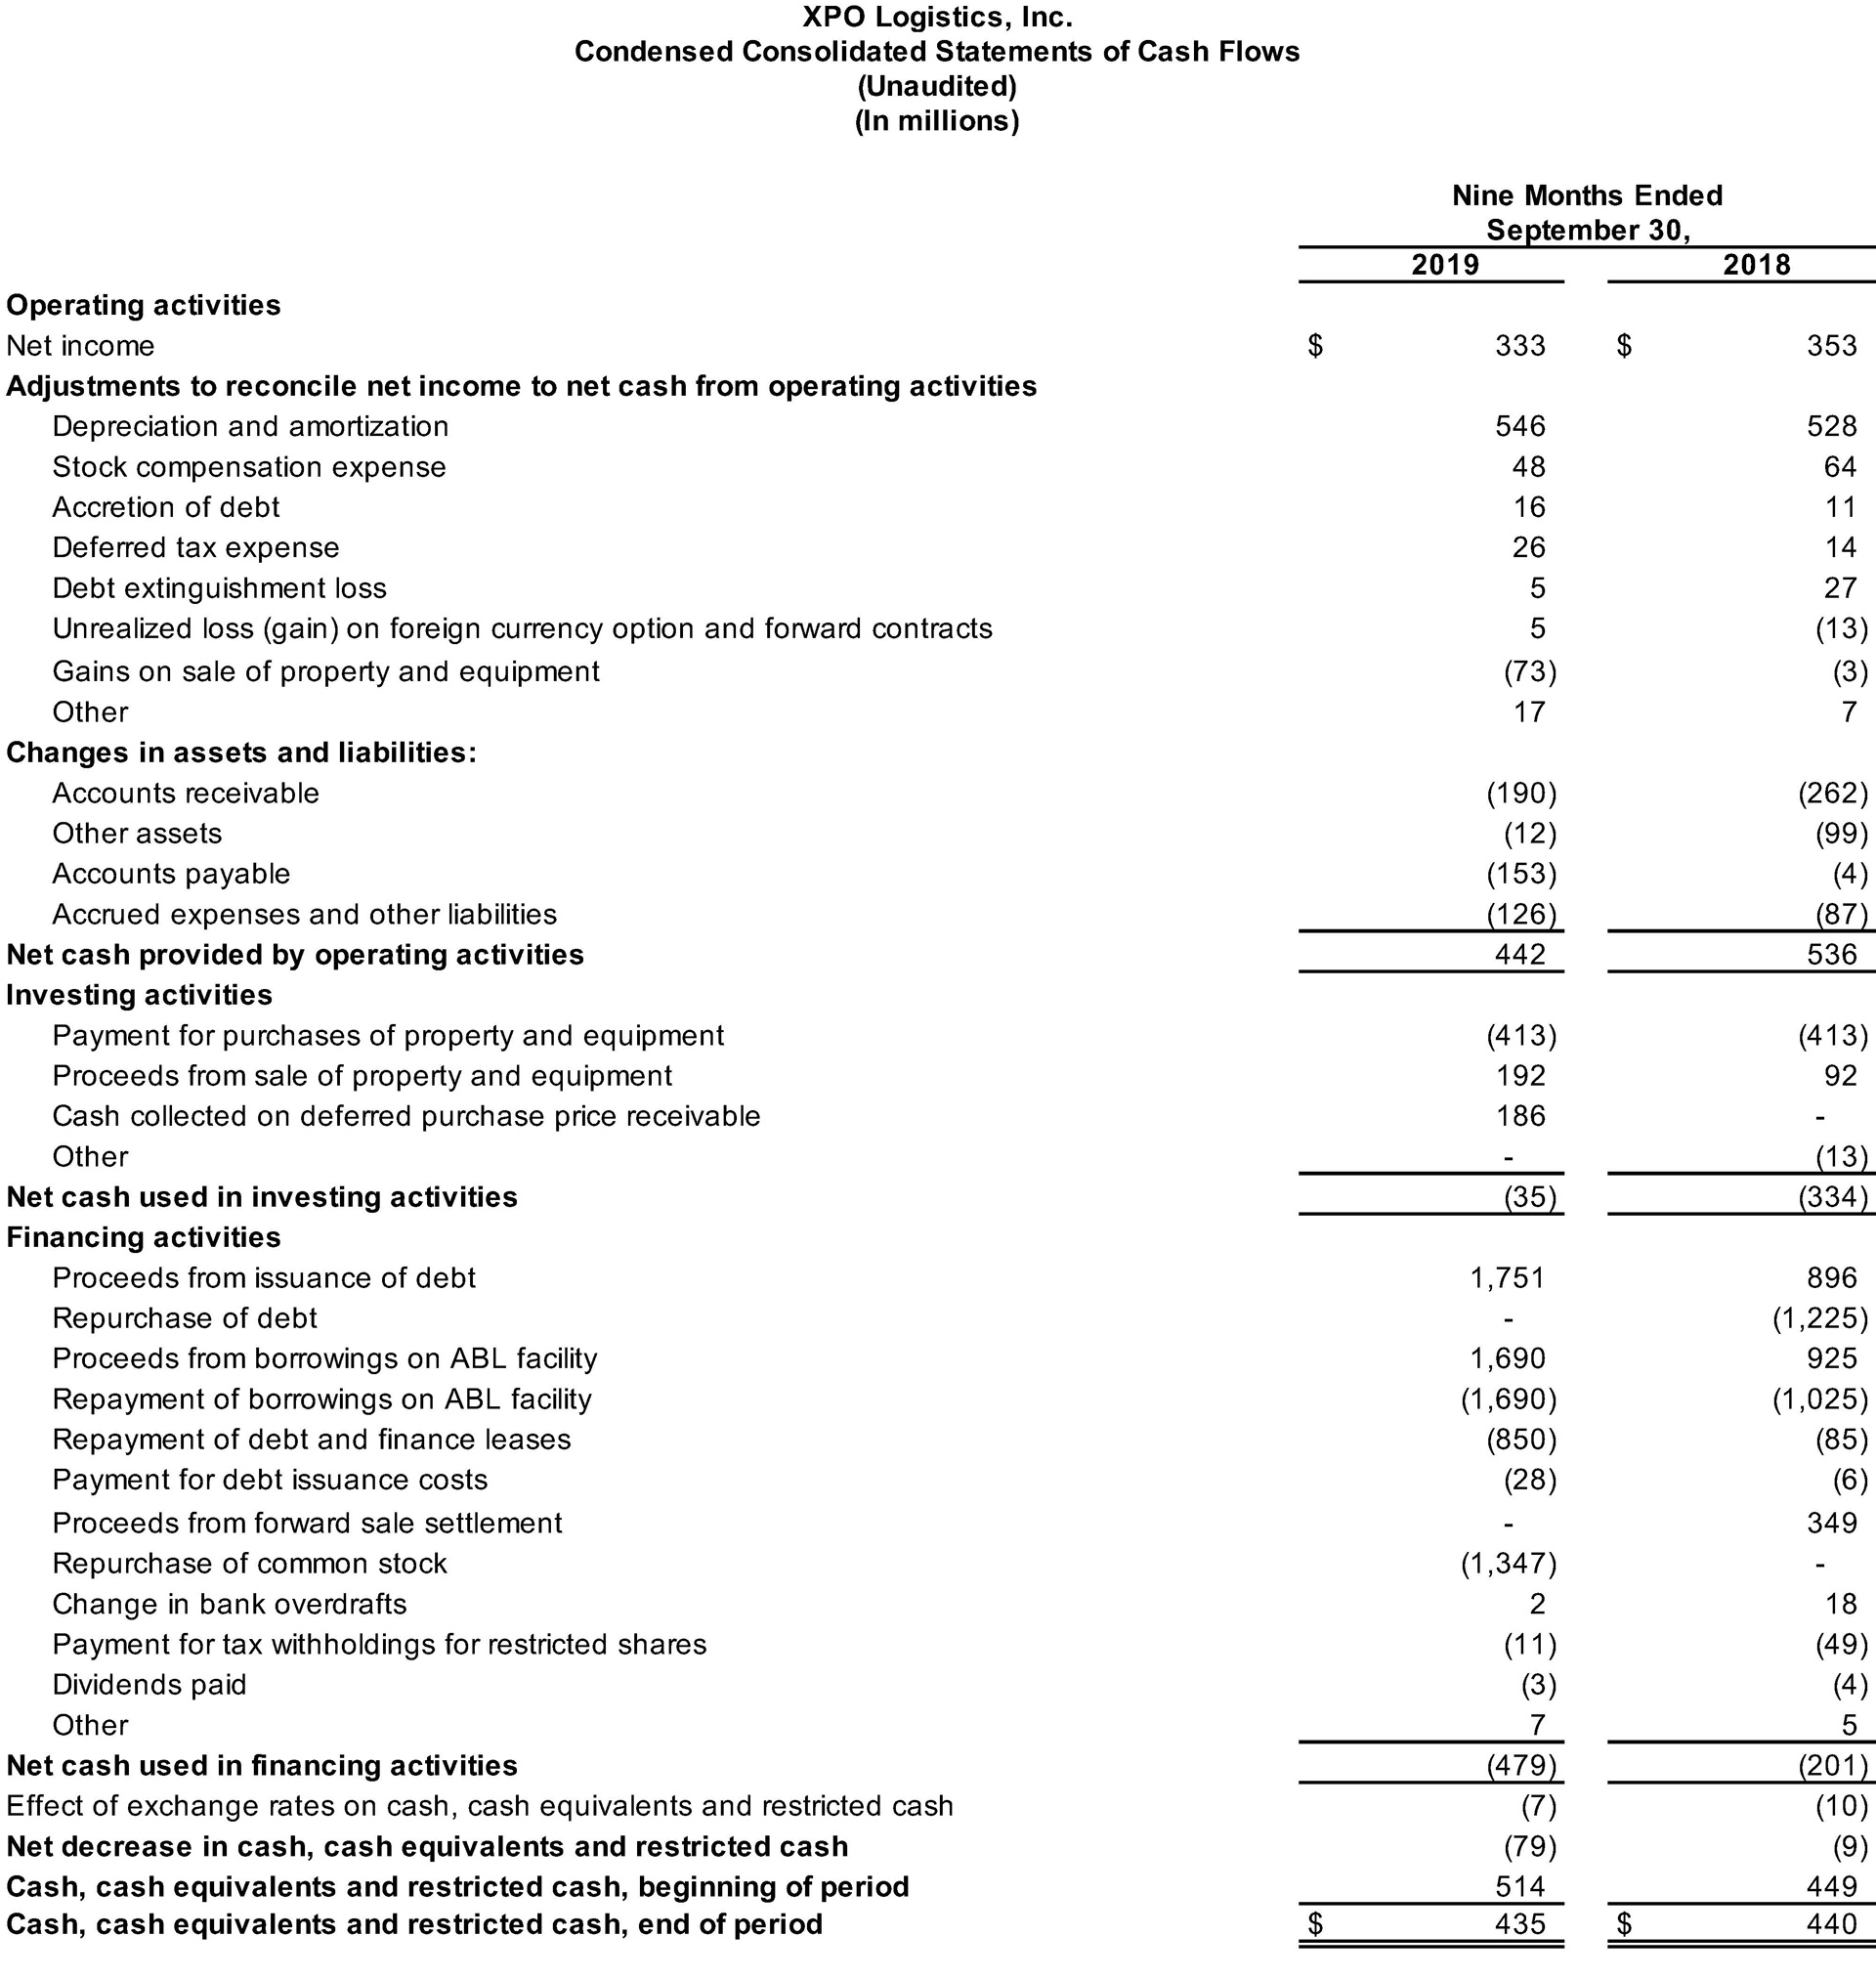
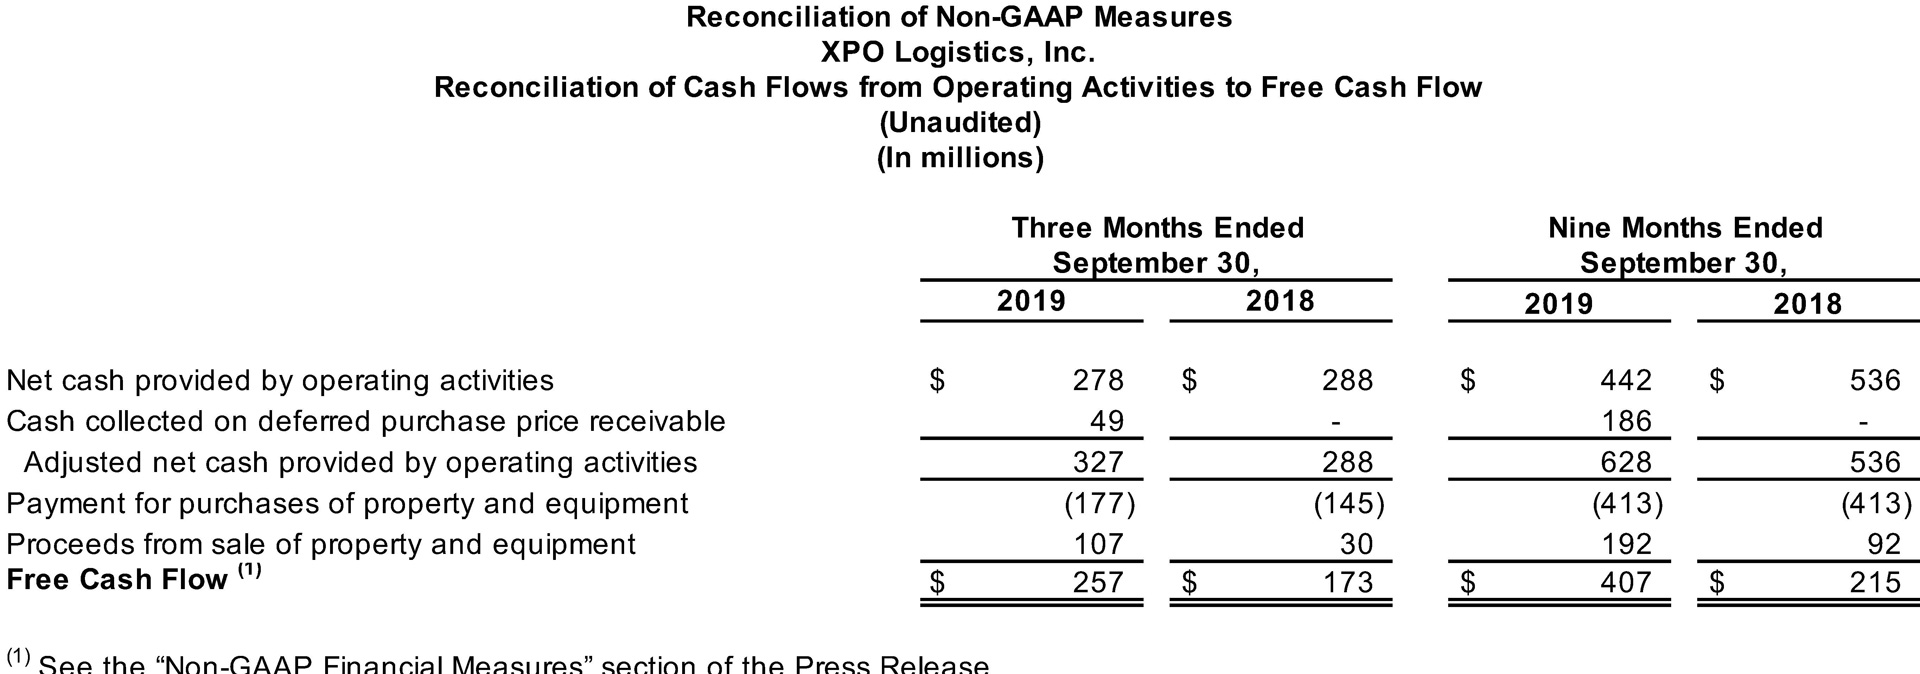
For the third quarter 2019, the company generated $278 million of cash flow from operations and $257 million of free cash flow, a non-GAAP financial measure. Reconciliations of non-GAAP financial measures used in this release are provided in the attached financial tables.
Updates 2019 Financial Targets
The company updated its full-year 2019 targets for revenue, depreciation and amortization, effective tax rate and cash taxes, and reaffirmed its targets for adjusted EBITDA, free cash flow and net capital expenditures, as follows:
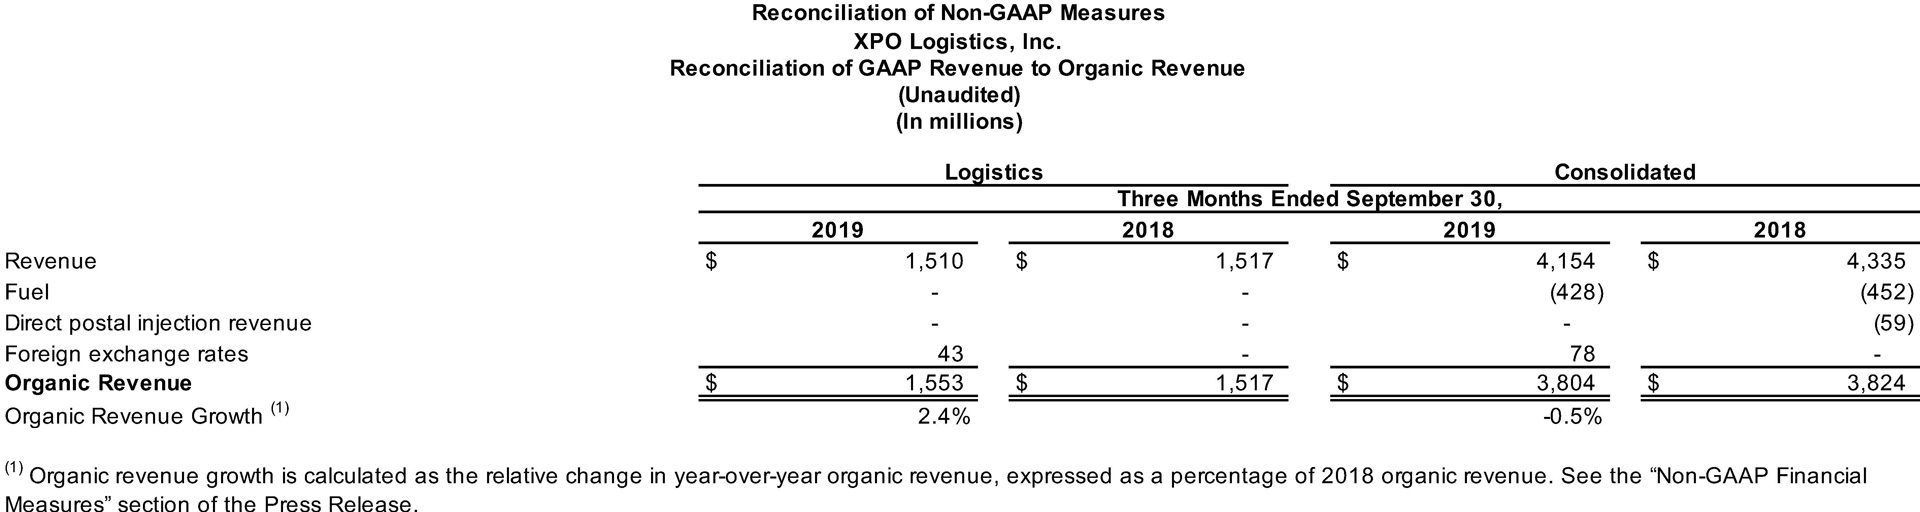
- Revenue of (2.5%) to (4.0%) year-over-year, from (1%) to 1% previously; which translates to organic revenue growth, a non-GAAP financial measure, of flat to 1.0%, from 2.5% to 4.5% previously. The update to revenue reflects the company’s expectation for continued softness in the macro environment;
- Adjusted EBITDA in the range of $1.675 billion to $1.725 billion, or year-over-year growth of 7% to 10%, unchanged from prior guidance;
- Free cash flow in the range of $575 million to $675 million, unchanged;
- Net capital expenditures in the range of $400 million to $450 million, unchanged;
- Depreciation and amortization in the range of $745 million to $765 million, from $765 million to $785 million previously;
- Effective tax rate in the range of 23% to 25%, from 25% to 28% previously; and
- Cash taxes in the range of $110 million to $130 million, from $130 million to $150 million previously.
The company’s 2019 targets for free cash flow and cash taxes assume cash interest expense of $275 million to $290 million. The company continues to expect an incremental benefit to free cash flow of $125 million to $150 million from trade receivables programs in 2019.
CEO Comments
Brad Jacobs, chairman and chief executive officer of XPO Logistics, said, “In the third quarter, we grew EPS by 54% and adjusted EPS by 33% year-over-year. We also delivered a solid beat on adjusted EBITDA, outpacing the macro through cost control and margin discipline. In less-than-truckload, our adjusted operating ratio was a third quarter record. We remain firmly on track to generate at least $1 billion of EBITDA from LTL in 2021.”
Jacobs continued, “Our significant investments in technology are creating tailwinds across our operations. We’re executing on 10 initiatives that represent a pool of $700 million to $1 billion of potential profit improvement over the next several years. One large opportunity is to apply our XPO Smart productivity tools to the $5 billion of annual costs related to our variable labor spend. All 10 initiatives are specific to XPO and largely independent of the operating environment. We’re very focused on the size of the prize and the meaningful potential uplift to our profitability.”
Third Quarter 2019 Results by Segment
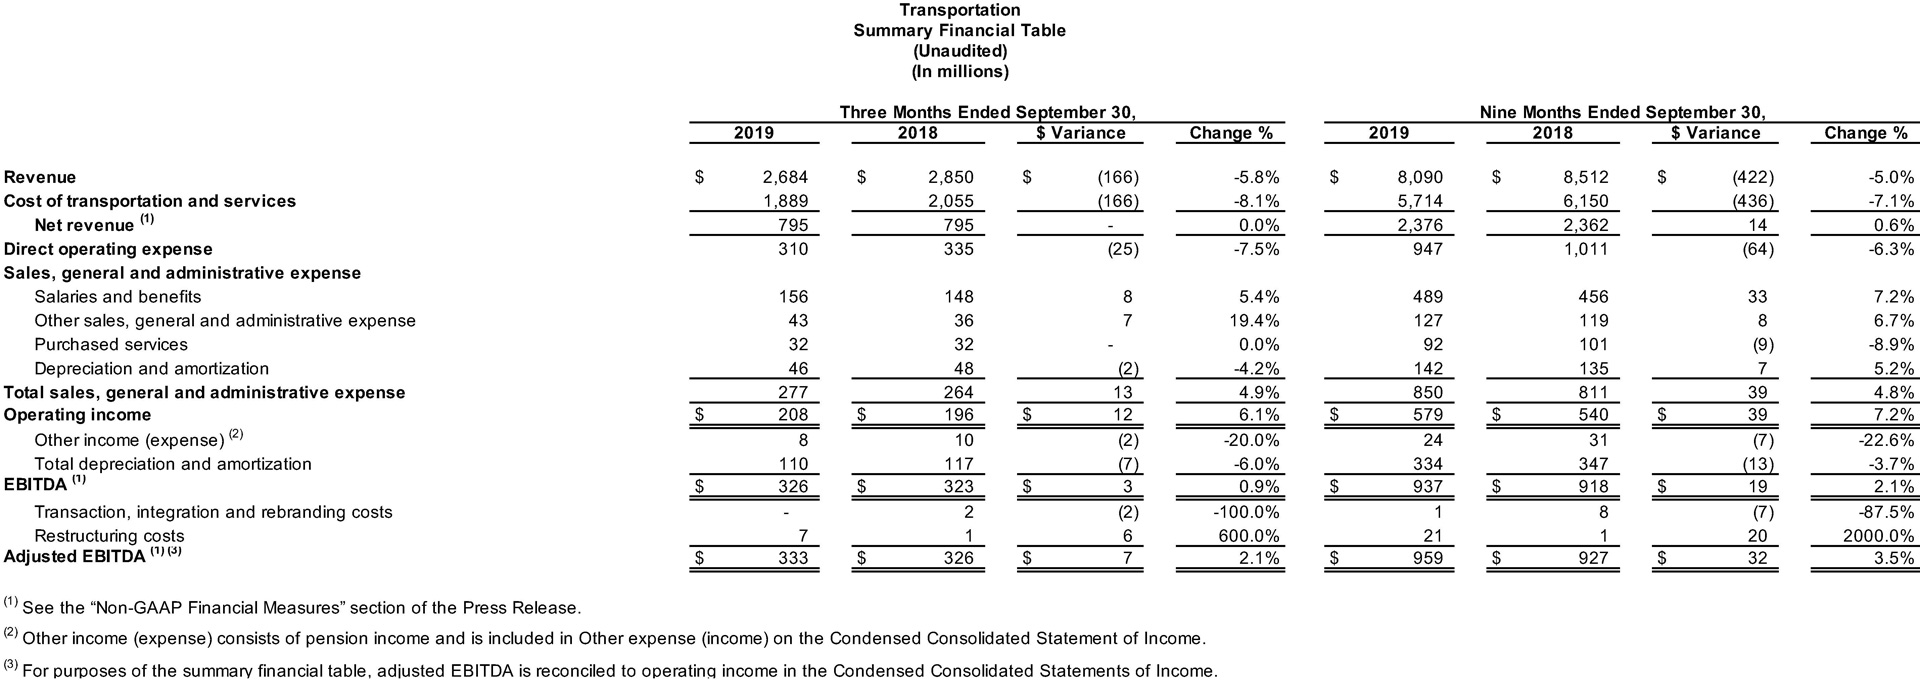
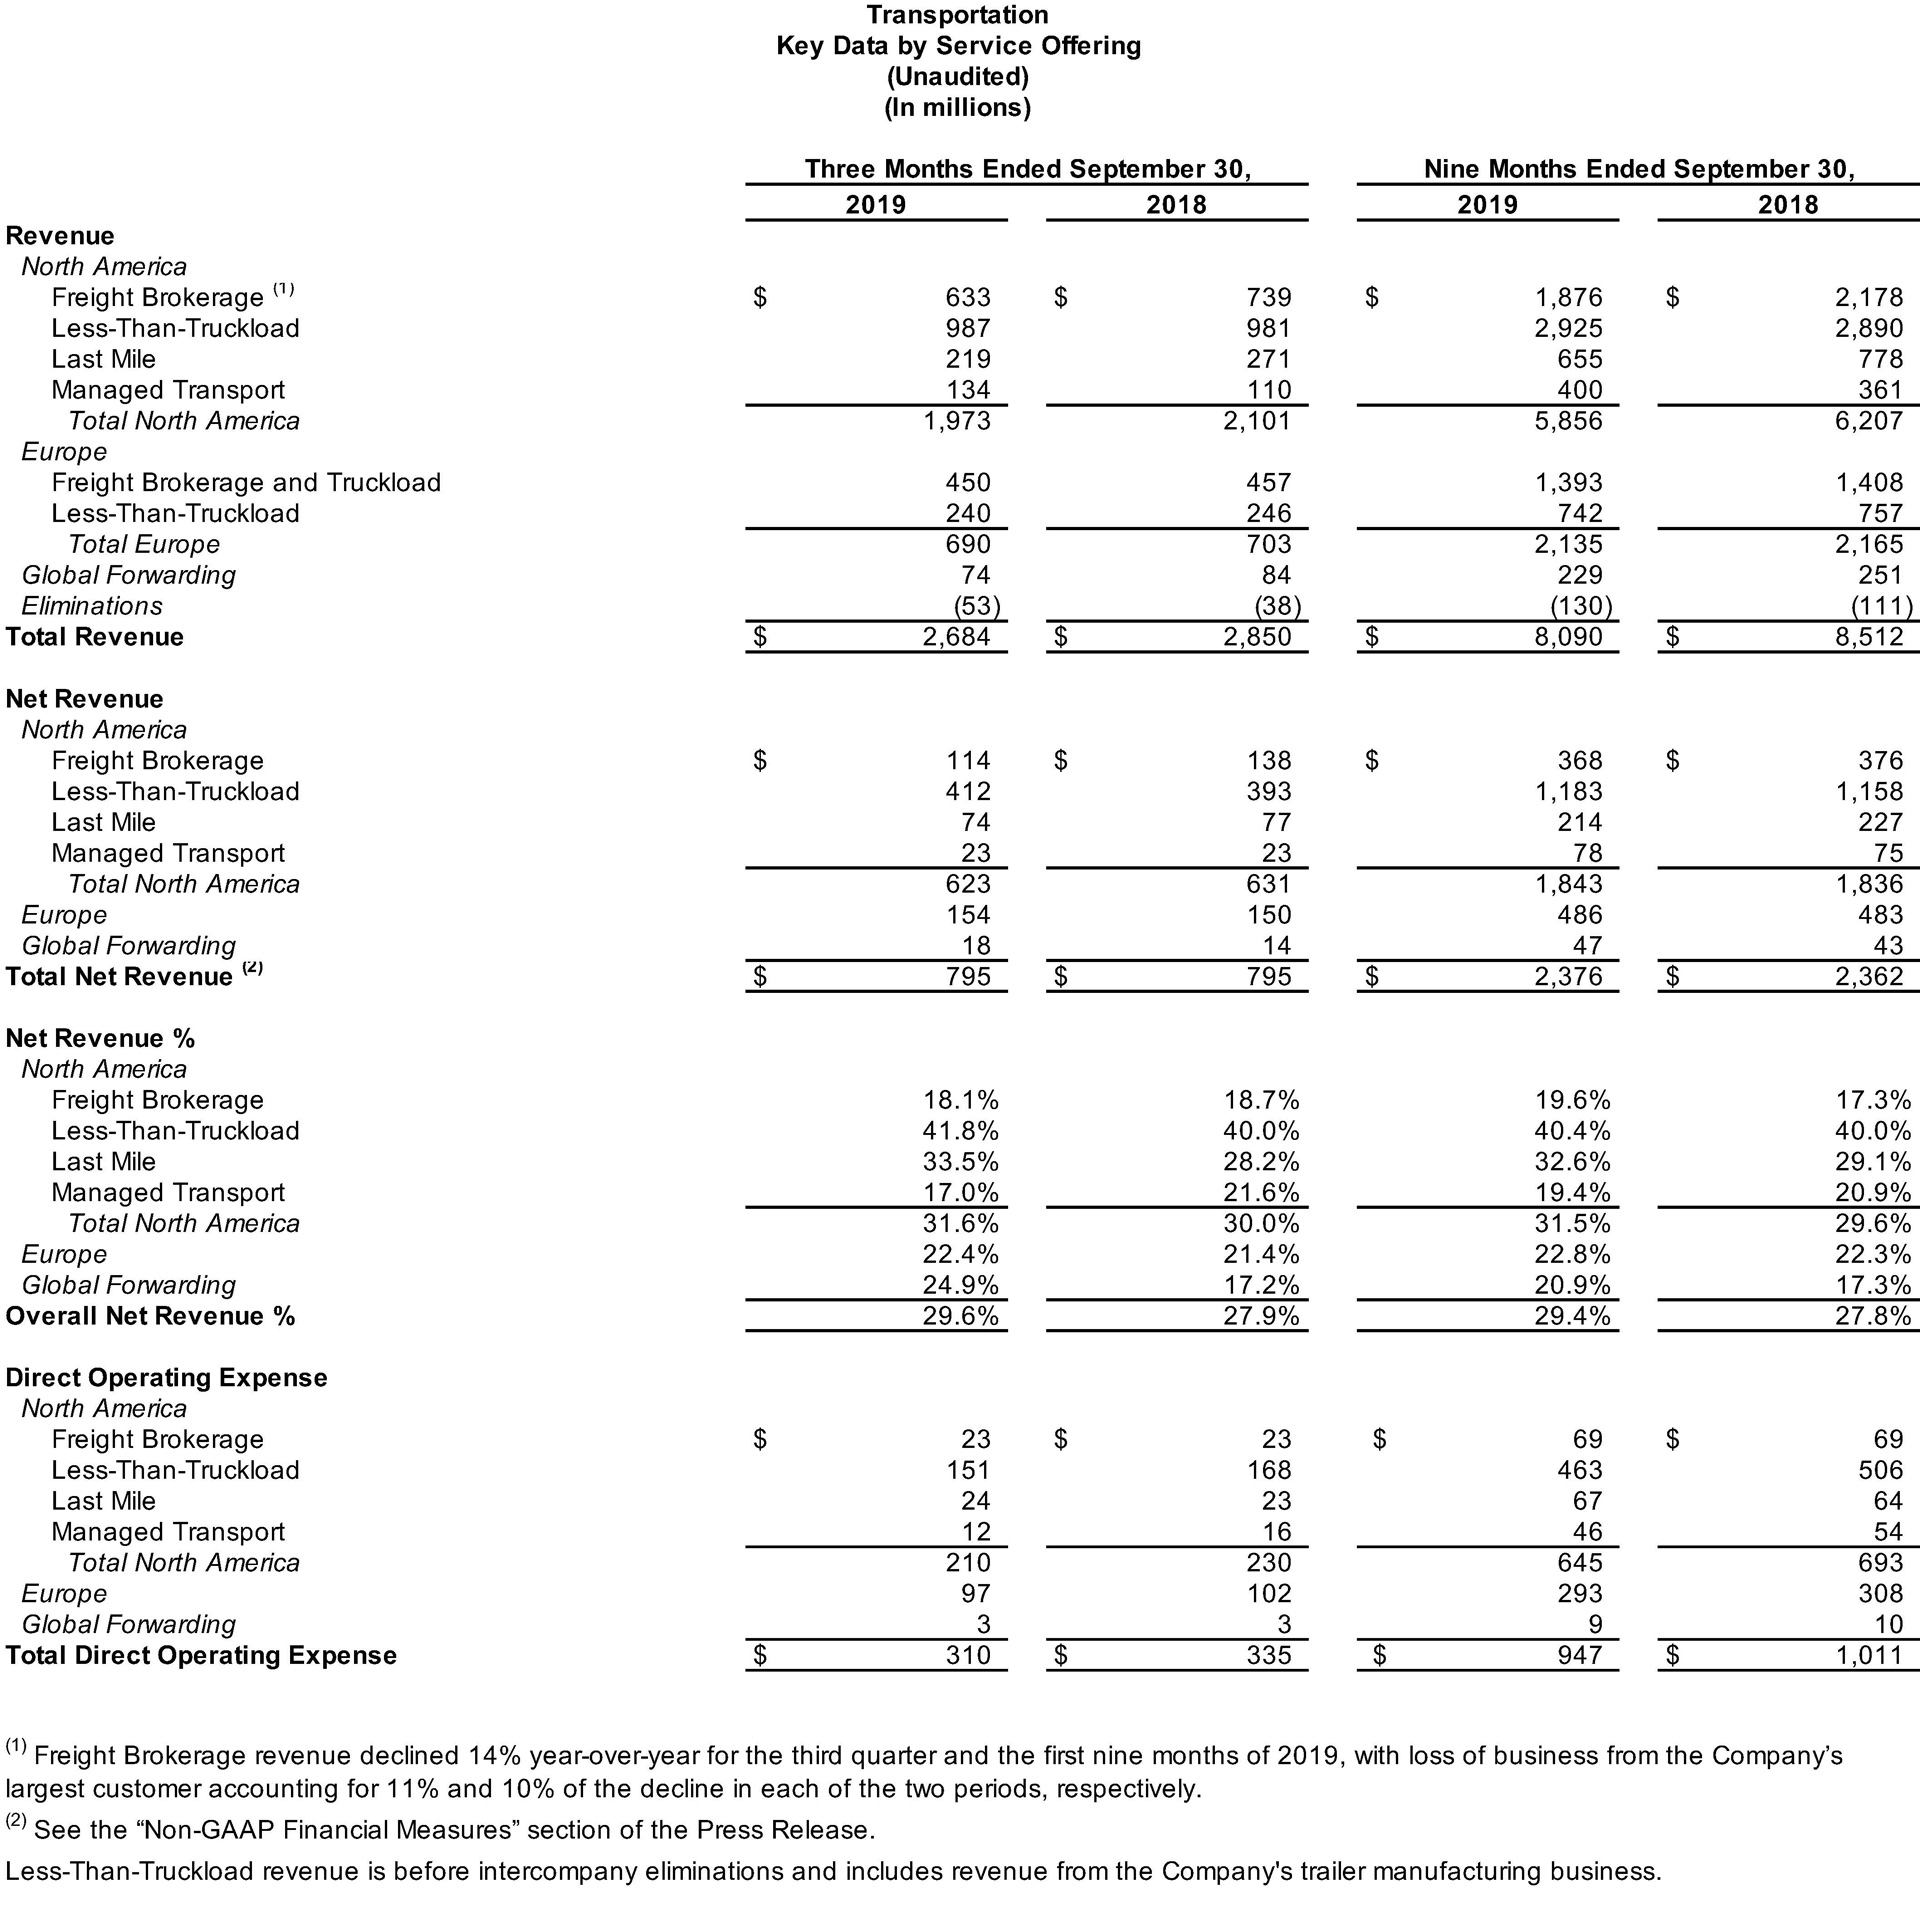
- Transportation: The company's transportation segment generated revenue of $2.68 billion for the third quarter 2019, compared with $2.85 billion for the same period in 2018. The reduction in segment revenue primarily reflects a decrease in freight brokerage and direct postal injection revenue from the company’s largest customer, lower rates in truck brokerage and unfavorable foreign currency exchange, partially offset by growth in managed transportation.
Operating income for the transportation segment was $208 million for the third quarter 2019, compared with $196 million for the same period in 2018. Adjusted EBITDA for the segment was $333 million for the quarter, compared with $326 million for the same period in 2018.
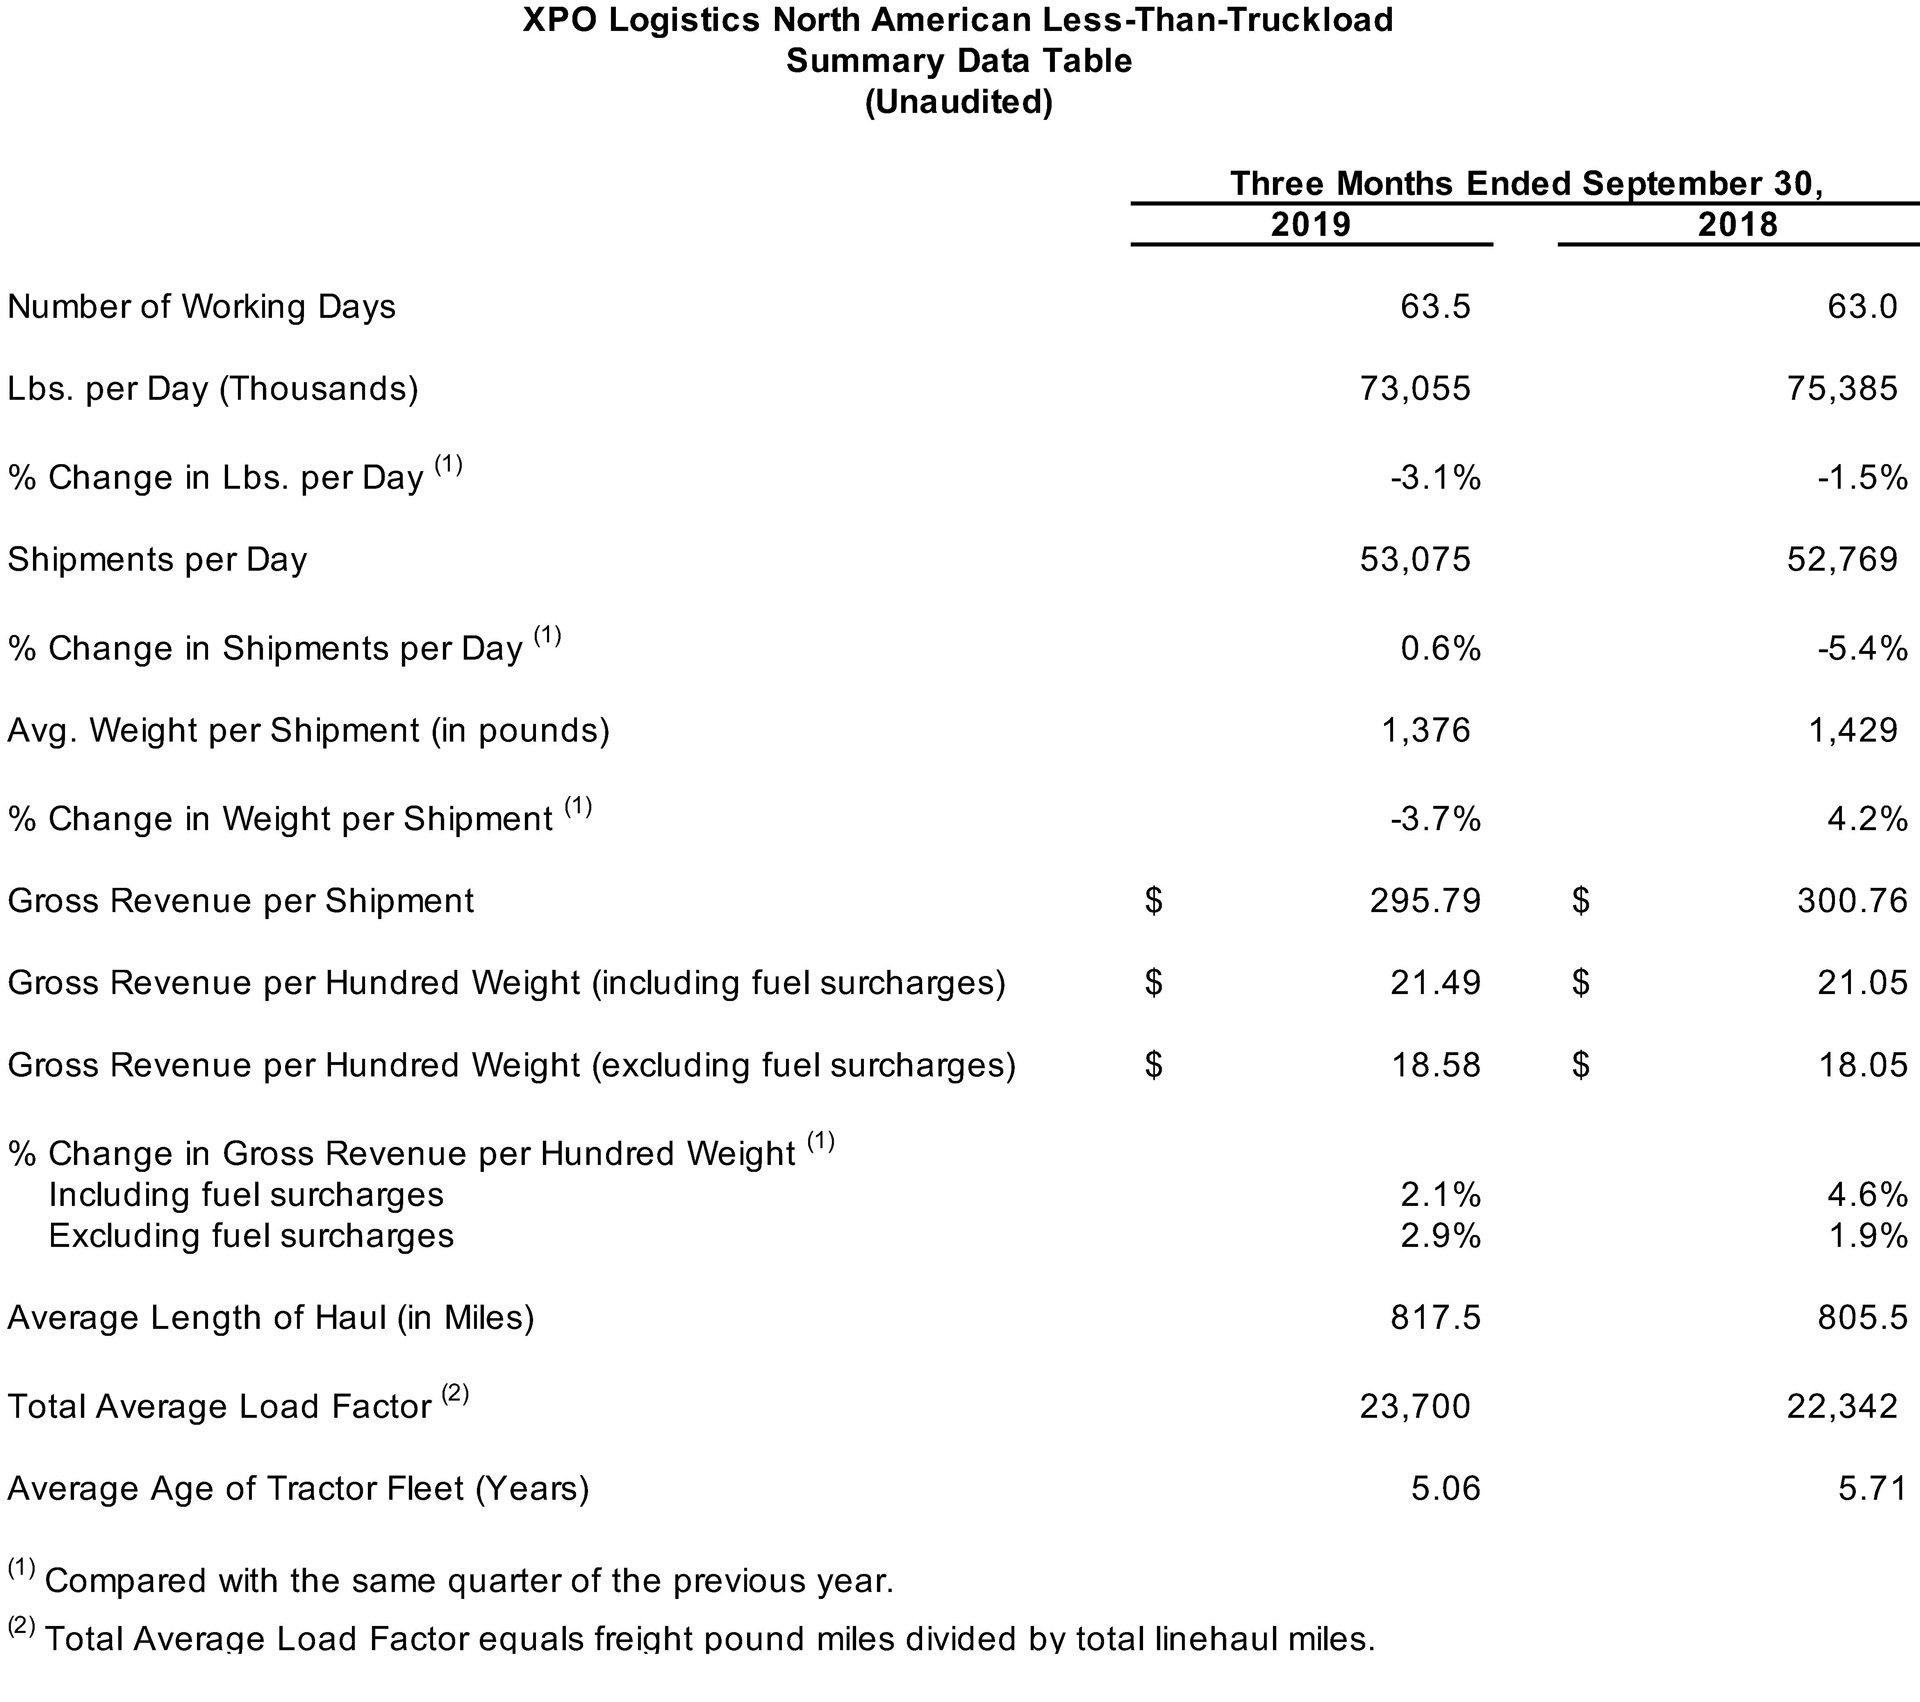
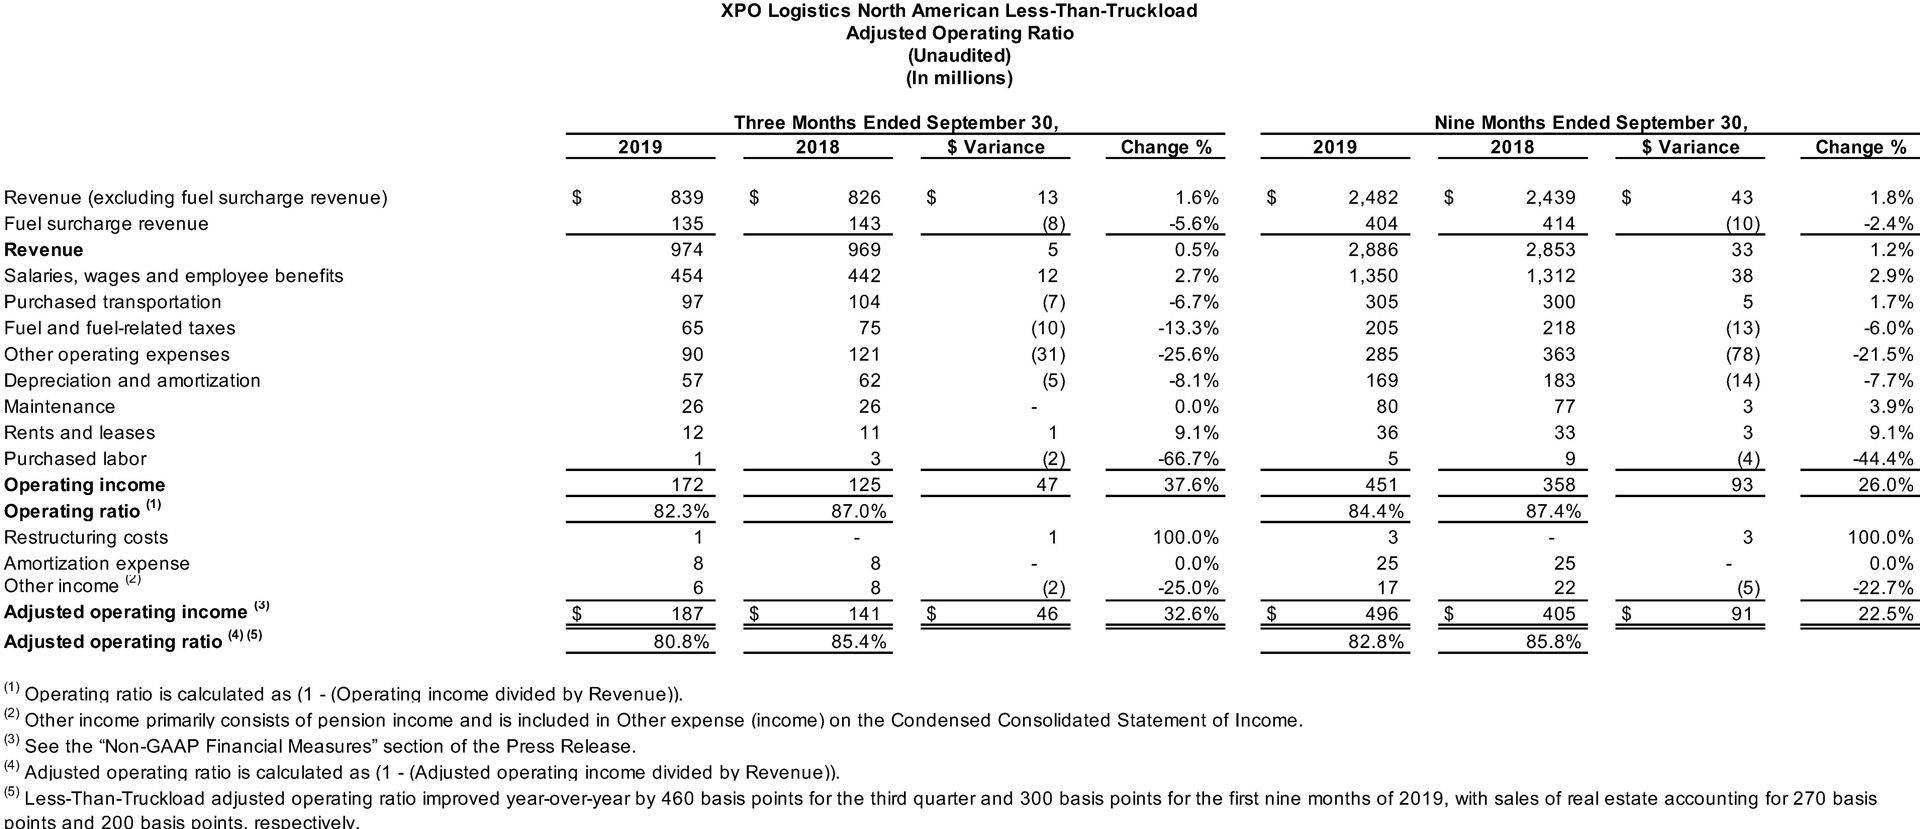
In North American LTL, yield, excluding fuel, improved by 2.9% year-over-year for the third quarter 2019. The third quarter operating ratio for LTL was 82.3%. Adjusted operating ratio, a non-GAAP financial measure, was a third quarter record at 80.8%, a 460 basis point improvement year-over-year.
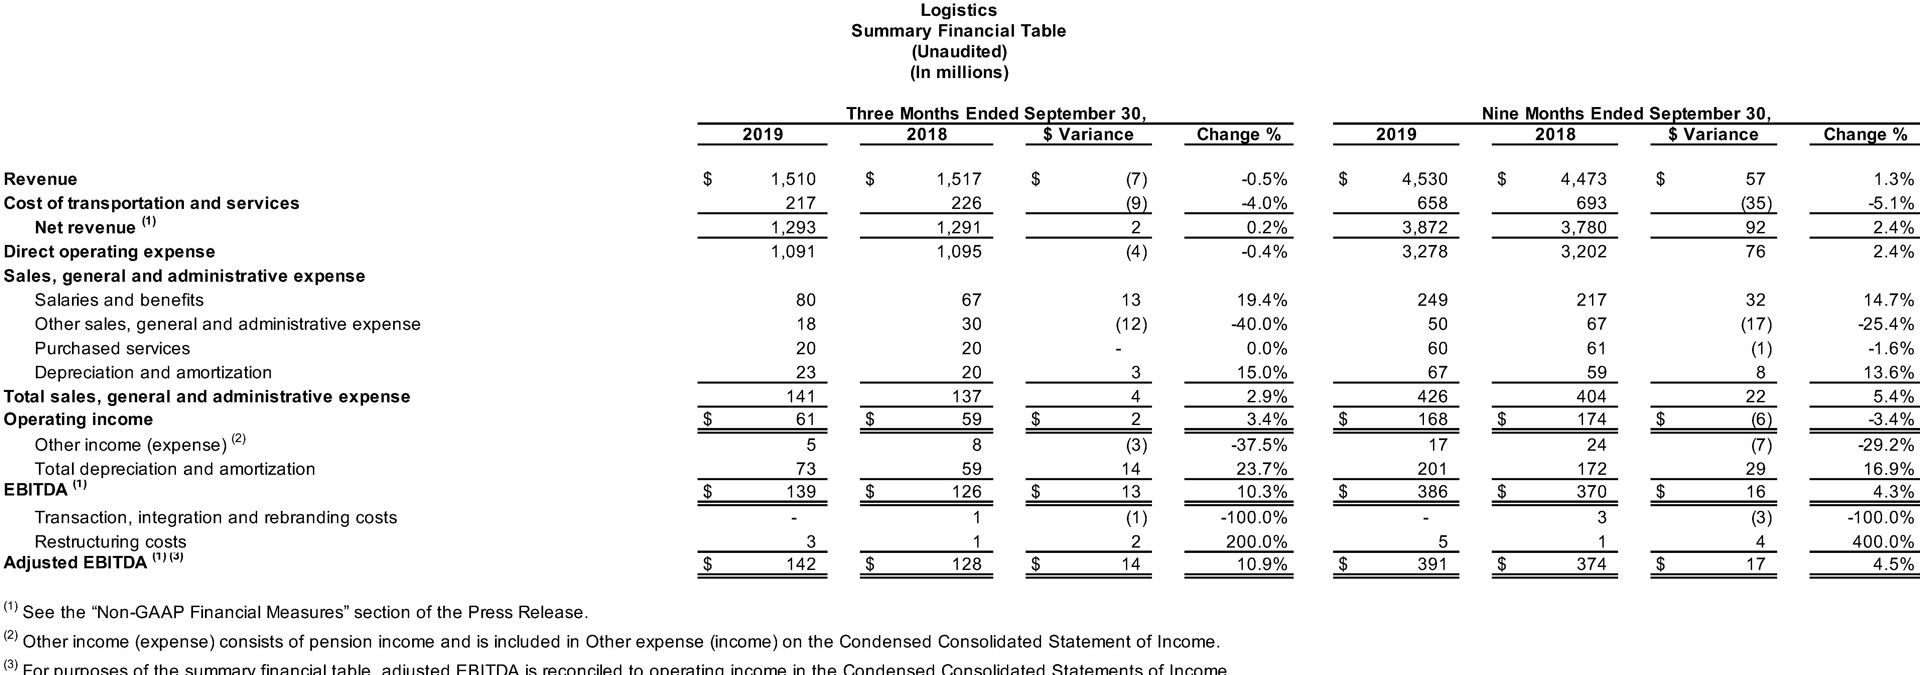
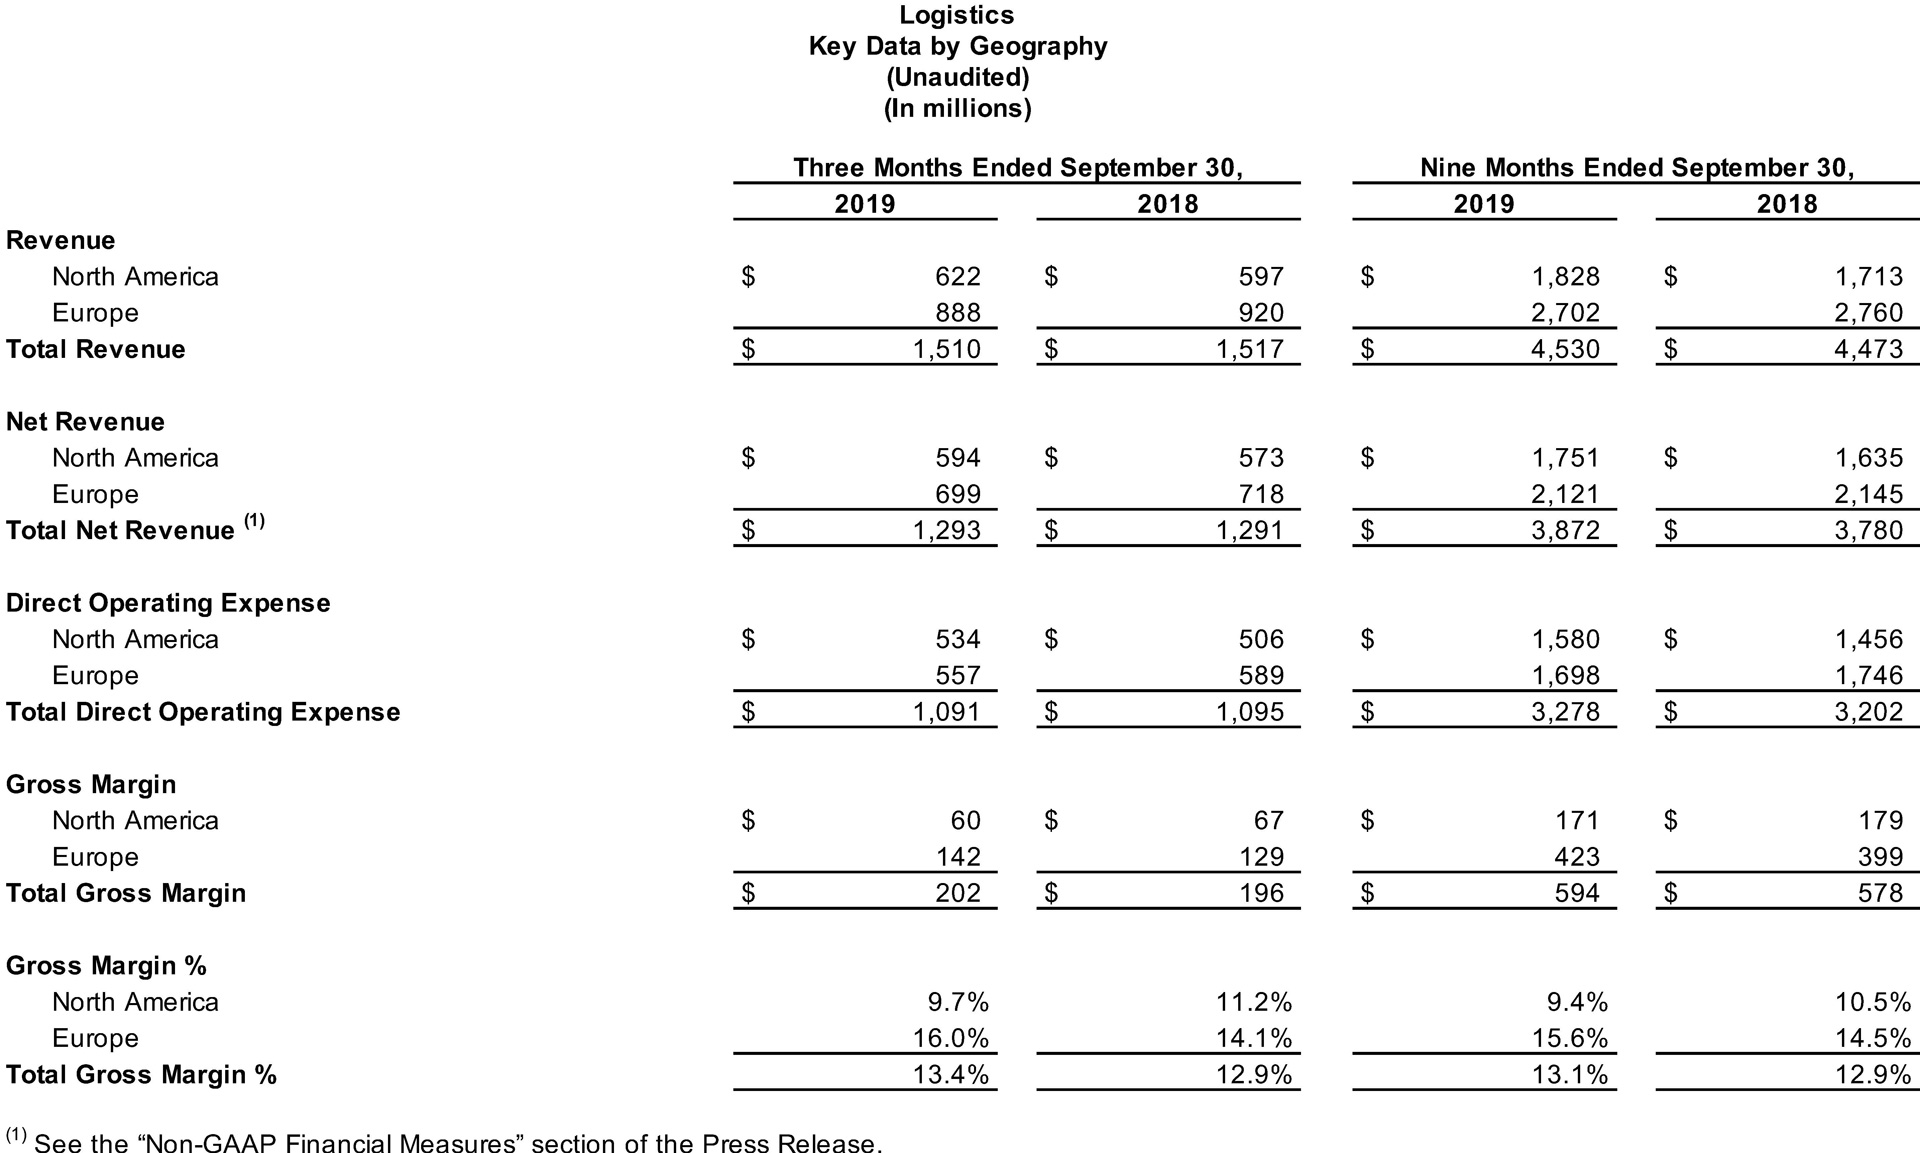
- Logistics: The company's logistics segment generated revenue of $1.51 billion for the third quarter 2019, compared with $1.52 billion for the same period in 2018. Organic revenue growth was 2.4%, led by consumer packaged goods, food and beverage and aerospace in North America, and by e-commerce in Europe, largely offset by a reduction in business from the company’s largest customer.
Operating income was $61 million for the third quarter 2019, compared with $59 million for the same period in 2018. Adjusted EBITDA for the segment was $142 million for the quarter, compared with $128 million from the same period in 2018. The increase in adjusted EBITDA primarily reflects growth from existing customers and from new business startups in recent quarters, offset in part by a reduction in business from the company’s largest customer and unfavorable foreign currency exchange.
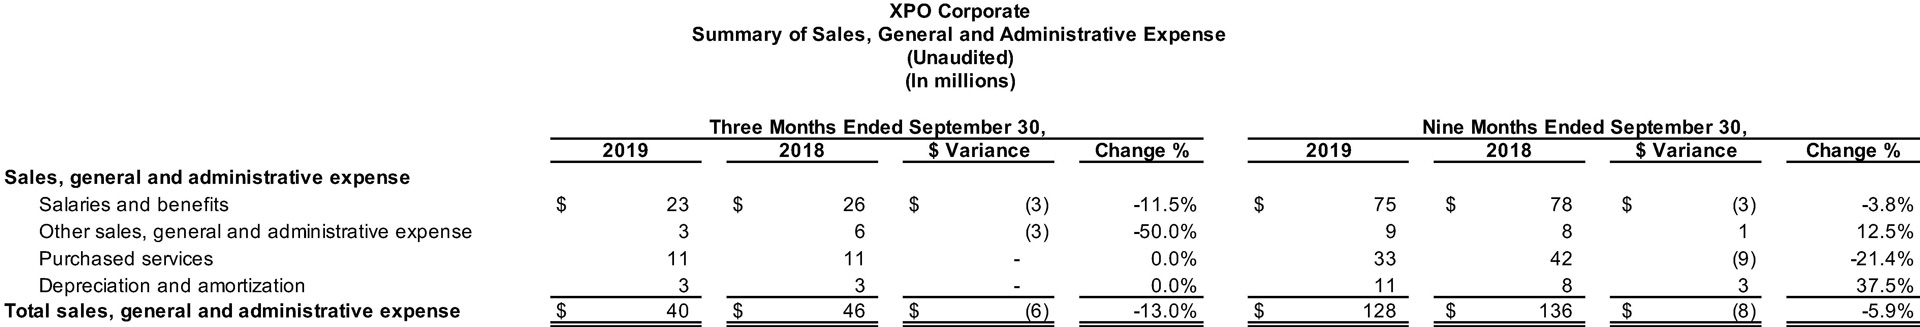
- Corporate: Corporate SG&A expense was $40 million for the third quarter 2019, compared with $46 million for the same period in 2018.
Nine Months 2019 Financial Results
For the nine months ended September 30, 2019, the company reported total revenue of $12.51 billion, compared with $12.89 billion for the same period in 2018. Net income attributable to common shareholders was $282 million for the first nine months of 2019, compared with $306 million for the same period in 2018. Operating income was $619 million for the first nine months of 2019, compared with $578 million for the same period in 2018. Earnings per diluted share was $2.63 for the first nine months of 2019, compared with $2.26 for the same period in 2018.
Adjusted net income attributable to common shareholders was $312 million for the first nine months of 2019, compared with $334 million for the same period in 2018. Adjusted earnings per diluted share was $2.91 for the first nine months of 2019, compared with $2.48 for the same period in 2018. Adjusted net income attributable to common shareholders and adjusted earnings per diluted share for the first nine months of 2019 exclude: $28 million, or $20 million after-tax, of restructuring costs, primarily severance; a non-cash charge of $6 million, or $4 million after-tax, related to the impairment of customer relationship intangibles; $5 million, or $4 million after-tax, of non-cash unrealized losses on foreign currency contracts; $5 million, or $4 million after-tax, of debt extinguishment costs; and $2 million, or $2 million after-tax, of transaction, integration and rebranding costs.
Adjusted EBITDA for the first nine months of 2019 increased to $1.24 billion, compared with $1.18 billion for the same period in 2018. Adjusted EBITDA for the first nine months of 2019 excludes: $28 million of restructuring costs, primarily severance; and $2 million of transaction, integration and rebranding costs.
Conference Call
The company will hold a conference call on Tuesday, October 29, 2019, at 8:30 a.m. Eastern Time. Participants can call toll-free (from US/Canada) 1-877-269-7756; international callers dial +1-201-689-7817. A live webcast of the conference will be available on the investor relations area of the company’s website, xpo.com/investors. The conference will be archived until November 29, 2019. To access the replay by phone, call toll-free (from US/Canada) 1-877-660-6853; international callers dial +1-201-612-7415. Use participant passcode 13695126.
Non-GAAP Financial Measures
As required by the rules of the Securities and Exchange Commission ("SEC"), we provide reconciliations of the non-GAAP financial measures contained in this press release to the most directly comparable measure under GAAP, which are set forth in the financial tables attached to this release.
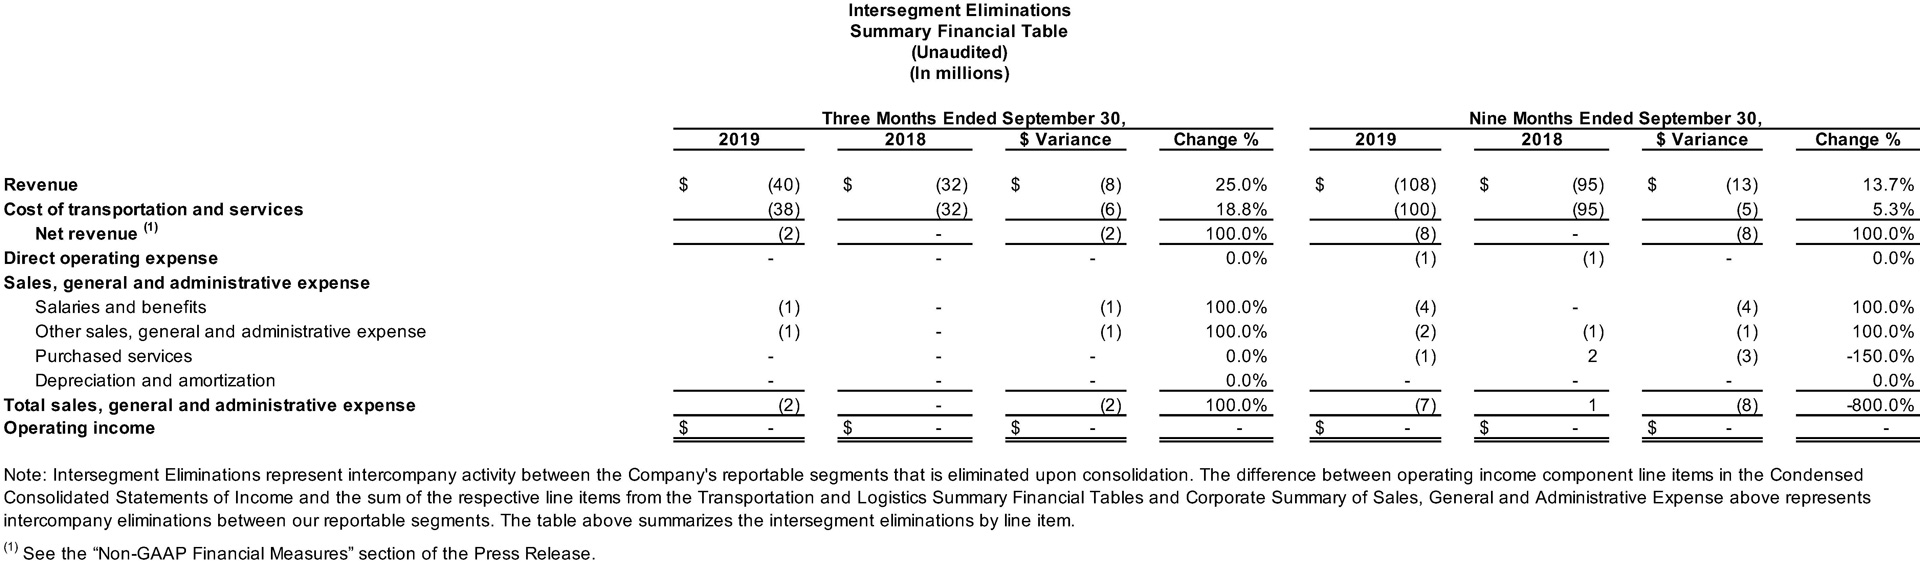
XPO’s non-GAAP financial measures for the three and nine months ended September 30, 2019 used in this release include: earnings before interest, taxes, depreciation and amortization ("EBITDA") and adjusted EBITDA on a consolidated basis and for our transportation and logistics segments; free cash flow; adjusted net income attributable to common shareholders and adjusted earnings per share (basic and diluted) ("adjusted EPS"); net revenue for our transportation and logistics segments and intersegment eliminations; adjusted operating income and adjusted operating ratio for our North American less-than-truckload business; and organic revenue and organic revenue growth on a consolidated basis and for our logistics business.
We believe that the above adjusted financial measures facilitate analysis of our ongoing business operations because they exclude items that may not be reflective of, or are unrelated to, XPO and its business segments' core operating performance, and may assist investors with comparisons to prior periods and assessing trends in our underlying businesses. Other companies may calculate these non-GAAP financial measures differently, and therefore our measures may not be comparable to similarly titled measures of other companies. These non-GAAP financial measures should only be used as supplemental measures of our operating performance.
Adjusted EBITDA, adjusted net income attributable to common shareholders and adjusted EPS include adjustments for transaction, integration and rebranding costs as well as adjustments for restructuring costs. Transaction and integration adjustments are generally incremental costs that result from an actual or planned acquisition and include transaction costs, acquisition and integration consulting fees, internal salaries and wages (to the extent the individuals are assigned full-time to integration and transformation activities) and certain costs related to integrating and converging IT systems. Rebranding adjustments primarily relate to the rebranding of the XPO Logistics name on our truck fleet and buildings. Restructuring costs primarily relate to severance costs associated with business optimization initiatives. Management uses these non-GAAP financial measures in making financial, operating and planning decisions and evaluating XPO's and each business segment's ongoing performance.
We believe that free cash flow is an important measure of our ability to repay maturing debt or fund other uses of capital that we believe will enhance stockholder value. We calculate free cash flow as adjusted net cash provided by operating activities, less payment for purchases of property and equipment plus proceeds from sale of property and equipment, with adjusted net cash
provided by operating activities defined as net cash provided by operating activities plus cash collected on deferred purchase price receivables. We believe that EBITDA and adjusted EBITDA improve comparability from period to period by removing the impact of our capital structure (interest and financing expenses), asset base (depreciation and amortization), tax impacts and other adjustments as set out in the attached tables that management has determined are not reflective of core operating activities and thereby assist investors with assessing trends in our underlying businesses. We believe that adjusted net income attributable to common shareholders and adjusted EPS improve the comparability of our operating results from period to period by removing the impact of certain costs and gains that management has determined are not reflective of our core operating activities. We believe that net revenue improves the comparability of our operating results from period to period by removing the cost of transportation and services, in particular the cost of fuel, incurred in the reporting period as set out in the attached tables. We believe that adjusted operating income and adjusted operating ratio for our North American less-than-truckload business improve the comparability of our operating results from period to period by (i) removing the impact of certain restructuring costs and amortization expenses and, (ii) including the impact of pension income incurred in the reporting period as set out in the attached tables. We believe that organic revenue is an important measure because it excludes the following items: foreign currency exchange rate fluctuations, fuel surcharges and revenue associated with our direct postal injection service in last mile.
With respect to our 2019 financial targets for adjusted EBITDA, free cash flow and organic revenue, as well as our 2021 target for EBITDA in our North American less-than-truckload business, each of which is a non-GAAP measure, a reconciliation of the non-GAAP measure to the corresponding GAAP measure is not available without unreasonable effort due to the variability and complexity of the reconciling items described below that we exclude from the non-GAAP target measure. The variability of these items may have a significant impact on our future GAAP financial results and, as a result, we are unable to prepare the forward-looking balance sheet, statement of income and statement of cash flow, prepared in accordance with GAAP that would be required to produce such a reconciliation.
Forward-looking Statements
This release includes forward-looking statements within the meaning of Section 27A of the Securities Act of 1933, as amended, and Section 21E of the Securities Exchange Act of 1934, as amended, including our 2019 financial targets for our consolidated revenue and organic revenue, adjusted EBITDA, free cash flow, net capital expenditures, depreciation and amortization, effective tax rate, cash taxes and the free cash flow benefit from our trade receivables programs, as well as our 2021 target for EBITDA in our North American less-than-truckload business and our potential profit growth opportunity by 2022. All statements other than statements of historical fact are, or may be deemed to be, forward-looking statements. In some cases, forward-looking statements can be identified by the use of forward-looking terms such as "anticipate," "estimate," "believe," "continue," "could," "intend," "may," "plan," "potential," "predict," "should," "will," "expect," "objective," "projection," "forecast," "goal," "guidance," "outlook," "effort," "target," "trajectory" or the negative of these terms or other comparable terms. However, the absence of these words does not mean that the statements are not forward-looking. These forward-looking statements are based on certain assumptions and analyses made by us in light of our experience and our perception of historical trends, current conditions and expected future developments, as well as other factors we believe are appropriate in the circumstances.
These forward-looking statements are subject to known and unknown risks, uncertainties and assumptions that may cause actual results, levels of activity, performance or achievements to be materially different from any future results, levels of activity, performance or achievements expressed or implied by such forward-looking statements. Factors that might cause or contribute to a material difference include the risks discussed in our filings with the SEC and the following: economic conditions generally; competition and pricing pressures; our ability to align our investments in capital assets, including equipment, service centers and warehouses, to our customers' demands; our ability to successfully integrate and realize anticipated synergies, cost savings and profit improvement opportunities with respect to acquired companies; our ability to develop and implement suitable information technology systems and prevent failures in or breaches of such systems; our substantial indebtedness; our ability to raise debt and equity capital; our ability to maintain positive relationships with our network of third-party transportation providers; our ability to attract and retain qualified drivers; litigation, including litigation related to alleged misclassification of independent contractors and securities class actions; labor matters, including our ability to manage our subcontractors, and risks associated with labor disputes at our customers and efforts by labor organizations to organize our employees; risks associated with our self-insured claims; risks associated with defined benefit plans for our current and former employees; fluctuations in currency exchange rates; fluctuations in fixed and floating interest rates; fuel price and fuel surcharge changes; issues related to our intellectual property rights; governmental regulation, including trade compliance laws; and governmental or political actions, including the United Kingdom's likely exit from the European Union. All forward-looking statements set forth in this release are qualified by these cautionary statements and there can be no assurance that the actual results or developments anticipated by us will be realized or, even if substantially realized, that they will have the expected consequences to or effects on us or our business or operations. Forward-looking statements set forth in this release speak only as of the date hereof, and we do not undertake any obligation to update forward-looking statements to reflect subsequent events or circumstances, changes in expectations or the occurrence of unanticipated events, except to the extent required by law.